
Alexandria Real Estate Equities, Inc. Reports: 2018 Revenues of $1.3 billion, up 17.7% over 2017; 4Q18 Loss Per Share - Diluted of $(0.30) and 2018 EPS - Diluted of $3.52; 4Q18 and 2018 FFO - Diluted,
Alexandria Real Estate Equities, Inc. Reports: 2018 Revenues of $1.3 billion, up 17.7% over 2017; 4Q18 Loss Per Share - Diluted of $(0.30) and 2018 EPS - Diluted of $3.52; 4Q18 and 2018 FFO - Diluted, As Adjusted, Per Share of $1.68 and $6.60; Operational Excellence and Growing Dividends
PR Newswire
PASADENA, Calif., Feb. 4, 2019
PASADENA, Calif., Feb. 4, 2019 /PRNewswire/ -- Alexandria Real Estate Equities, Inc. (NYSE:ARE) announced financial and operating results for the fourth quarter and year ended December 31, 2018.
Key highlights
Operating results
4Q18 | 4Q17 | 2018 | 2017 | ||||||||||||
Total revenues: | |||||||||||||||
In millions | $ | 340.5 | $ | 298.8 | $ | 1,327.5 | $ | 1,128.1 | |||||||
Growth | 13.9% | 17.7% | |||||||||||||
Net (loss) income attributable to Alexandria's common stockholders – diluted: | |||||||||||||||
In millions | $ | (31.7) | $ | 36.8 | $ | 364.0 | $ | 145.4 | |||||||
Per share | $ | (0.30) | $ | 0.38 | $ | 3.52 | $ | 1.58 | |||||||
Funds from operations attributable to Alexandria's common stockholders – diluted, as adjusted: | |||||||||||||||
In millions | $ | 178.0 | $ | 147.0 | $ | 682.0 | $ | 554.5 | |||||||
Per share | $ | 1.68 | $ | 1.53 | $ | 6.60 | $ | 6.02 | |||||||
On January 1, 2018, we adopted a new accounting standard that requires us, on a prospective basis, to present certain equity investments at fair value with changes in fair value reflected in earnings. See "Items Included in Net (Loss) Income Attributable to Alexandria's Common Stockholders" on the next page for additional information. | |||||||||||||||
A REIT industry-leading, high-quality tenant roster
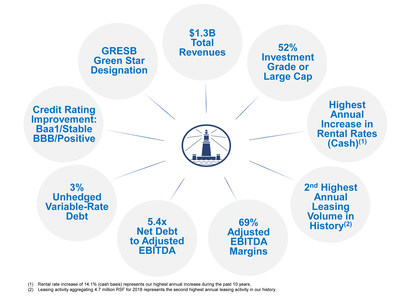
52% of annual rental revenue from investment-grade or publicly traded large cap tenants.
Continuation of strong rental rate growth and leasing activity
Strong rental rate increases of 24.1% and 14.1% (cash basis) for 2018. The rental rate increase of 14.1% (cash basis) represents our highest annual increase during the past 10 years. Our leasing activity aggregating 4.7 million RSF for 2018 represents the second highest annual leasing activity in our history.
Sale of partial interest in core Class A property
In February 2019, we executed a purchase and sale agreement to sell a 60% interest in 75/125 Binney Street, a Class A property in our Cambridge submarket, for a sales price of $438 million, or $1,880 per RSF, representing a 4.3% capitalization rate on 4Q18 net operating income (cash basis), annualized. We expect to complete this partial interest sale in 1Q19 and to reinvest these proceeds into our value-creation pipeline.
2018 credit rating improvement
During 2018, Moody's Investors Service upgraded our corporate issuer credit rating to Baa1/Stable from Baa2/Stable and S&P Global Ratings raised its credit outlook for our corporate credit rating to BBB/Positive from BBB/Stable.
Increased common stock dividend
Common stock dividend declared for 4Q18 of $0.97 per common share, up 4 cents, or 4.3%, over 3Q18; continuation of our strategy to share growth in cash flows from operating activities with our stockholders while also retaining a significant portion for reinvestment.
Investments
We carry our investments in publicly traded companies and certain privately held entities at fair value. As of December 31, 2018, cumulative unrealized gains related to changes in fair value aggregated $240.2 million. Investment income included the following:
- Unrealized losses of $94.9 million and unrealized gains of $99.6 million recognized in 4Q18 and 2018, respectively; and
- Realized gains of $11.3 million and $37.1 million recognized in 4Q18 and 2018, respectively.
Strong internal growth
- Net operating income (cash basis) of $878.0 million for 4Q18 annualized, up $184.9 million, or 26.7%, compared to 4Q17 annualized
- Same property net operating income growth:
- 3.8% and 7.6% (cash basis) for 4Q18, compared to 4Q17
- 3.7% and 9.2% (cash basis) for 2018, compared to 2017. Growth of 9.2% (cash basis) represents the highest annual increase during the past 10 years.
- Continued strong leasing activity and rental rate growth in light of modest contractual lease expirations at the beginning of 2018 and a highly leased value-creation pipeline:
4Q18 | 2018 | |||||
Total leasing activity – RSF | 1,558,064 | 4,721,692 | ||||
Lease renewals and re-leasing of space: | ||||||
RSF (included in total leasing activity above) | 650,540 | 2,088,216 | ||||
Rental rate increases | 17.4% | 24.1% | ||||
Rental rate increases (cash basis) | 11.4% | 14.1% | ||||
Strong external growth; disciplined allocation of capital to visible, highly leased value-creation pipeline
Significant development and redevelopment projects placed into service:
Property | Submarket | RSF | Leased | Tenant | ||||
4Q18: | ||||||||
213 East Grand Avenue | South San Francisco | 300,930 | 100% | Merck & Co., Inc. | ||||
9625 Towne Centre | University Town | 163,648 | 100% | Takeda Pharmaceutical | ||||
January 2019: | ||||||||
399 Binney Street | Cambridge | 123,403 | 100% | Three life science entities |
Future growth of net operating income (cash basis) driven by recently delivered projects
Significant near-term growth of net operating income (cash basis) of $42 million upon the burn-off of initial free rent on recently delivered projects.
Completed acquisitions
During 4Q18, we acquired three properties for an aggregate purchase price of $155.0 million in two key submarkets.
Items included in results
Items included in net (loss) income attributable to Alexandria's common stockholders: | |||||||||||||||||||||||||||||||||
(In millions, except per share | 4Q18 | 4Q17 | 4Q18 | 4Q17 | 2018 | 2017 | 2018 | 2017 | |||||||||||||||||||||||||
Amount | Per Share – | Amount | Per Share – | ||||||||||||||||||||||||||||||
Unrealized (losses) gains on non- | $ | (94.9) | $ | — | $ | (0.89) | $ | — | $ | 99.6 | $ | — | $ | 0.96 | $ | — | |||||||||||||||||
Realized gains on non-real estate | 6.4 | — | 0.06 | — | 14.7 | — | 0.14 | — | |||||||||||||||||||||||||
Gain on sales of real estate | 8.7 | — | 0.08 | — | 44.4 | (2) | 14.5 | (2) | 0.43 | 0.15 | |||||||||||||||||||||||
Impairment of: | |||||||||||||||||||||||||||||||||
Real estate | — | — | — | — | (6.3) | (0.2) | (0.06) | — | |||||||||||||||||||||||||
Non-real estate investments | (5.5) | (3.8) | (0.05) | (0.04) | (5.5) | (8.3) | (0.05) | (0.09) | |||||||||||||||||||||||||
Early extinguishment of debt: | |||||||||||||||||||||||||||||||||
Loss | — | (2.8) | — | (0.03) | (1.1) | (3.5) | (0.01) | (0.03) | |||||||||||||||||||||||||
Gain | — | — | — | — | 0.8 | (2) | — | 0.01 | — | ||||||||||||||||||||||||
Preferred stock redemption charge | (4.2) | — | (0.04) | — | (4.2) | (11.3) | (0.04) | (0.12) | |||||||||||||||||||||||||
Allocation to unvested restricted | — | 0.1 | — | — | (2.2) | 0.1 | (0.02) | — | |||||||||||||||||||||||||
Total | $ | (89.5) | $ | (6.5) | $ | (0.84) | $ | (0.07) | $ | 140.2 | $ | (8.7) | $ | 1.36 | $ | (0.09) | |||||||||||||||||
Weighted-average shares of common stock | 106.0 | 95.9 | 103.3 | 92.1 | |||||||||||||||||||||||||||||
(1) See "Investments" on page 45 of our Supplemental Information for additional information. (2) Includes our share of amounts attributable to our unconsolidated real estate joint ventures. See "Joint Venture Financial Information" in our Supplemental Information for additional information. | |||||||||||||||||||||||||||||||||
Core operating metrics as of or for the quarter ended December 31, 2018
High-quality revenues and cash flows and operational excellence
Percentage of annual rental revenue in effect from: | ||||
Investment-grade or publicly traded large cap tenants | 52% | |||
Class A properties in AAA locations | 77% | |||
Occupancy of operating properties in North America | 97.3% | |||
Operating margin | 71% | |||
Adjusted EBITDA margin | 69% | |||
Weighted-average remaining lease term: | ||||
All tenants | 8.6 years | |||
Top 20 tenants | 12.3 years | |||
See the previous page for information on our total revenues, net operating income, same property net operating income growth, leasing activity, and rental rate growth.
Balance sheet management
Key metrics
- $18.4 billion of total market capitalization
- $2.4 billion of liquidity
- 3% unhedged variable-rate debt as a percentage of total debt
4Q18 | ||||||
Quarter | Trailing 12 | 4Q19 | ||||
Annualized | Months | Goal | ||||
Net debt to Adjusted EBITDA | 5.4x | 5.6x | Less than or | |||
Fixed-charge coverage ratio | 4.1x | 4.2x | Greater than 4.0x | |||
Current and future value-creation pipeline as a | 11% | N/A | 8% to 12% | |||
Key capital events
- During 4Q18, we executed additional interest rate hedge agreements with a notional of $250.0 million and a weighted-average fixed pay rate of 2.84%, effective March 29, 2019.
- During 4Q18, we repurchased, in privately negotiated transactions, 402,000 shares of our 7.00% Series D cumulative convertible preferred stock for $14.0 million, or $34.77 per share, and recognized a preferred stock redemption charge of $4.2 million.
- In November 2018, we exercised our option to extend the maturity date of our secured construction loan for our properties at 50 and 60 Binney Street in our Cambridge submarket to January 28, 2020.
- In December 2018, we settled the remaining 5.2 million shares from our January 2018 forward equity sales agreements and received proceeds of $608.1 million, or $116.97 per share, net of underwriting discounts and adjustments as provided for in the agreements.
- During 4Q18, there was no activity under our "at the market" common stock offering programs. As of December 31, 2018, the remaining aggregate amount available under our current programs for future sales of common stock is $658.7 million.
Corporate responsibility and industry leadership
- Our philanthropy and volunteerism efforts focus on providing mission-critical support to non-profit organizations doing impactful work in the areas of medical research, STEM education, military support services, and local communities. In 2018, our team members volunteered more than 2,600 hours to support over 250 non-profit organizations across the country.
- We value both the health and wellness of our team members as well as supporting organizations on the leading edge of medical innovation. In November 2018, we were honored to support 49 team members in the New York City Marathon in order to benefit Memorial Sloan Kettering Cancer Center.
- In November 2018, Robin Hood, New York City's largest poverty-fighting organization, held its annual investor conference, at which Joel S. Marcus, our executive chairman and founder, curated and moderated the "Go Long on Ag" panel that focused on the critical need for agricultural innovation to provide more nutritious food in order to feed a rapidly growing population.
- In November 2018, Ari Frankel, our assistant vice president of sustainability and high performance buildings, was elected 2019 Chair of Nareit's Real Estate Sustainability Council.
- In January 2019, we were recognized as the most active biopharma investor by new deal volume in 2017-2018 by Silicon Valley Bank in its "Trends in Healthcare Investments and Exits 2019" report and ranked by Forbes as the top venture capital investor in the healthcare sector by U.S.-based deal volume in 2018.
Subsequent events
- In January 2019, we repaid early one secured note payable aggregating $106.7 million, originally due in 2020 and that bore interest at 7.75%, and recognized a loss on early extinguishment of debt of $7.1 million, including the write-off of unamortized loan fees.
- In January 2019, we repurchased, in privately negotiated transactions, 275,000 shares of our 7.00% Series D cumulative convertible preferred stock for $9.2 million, or $33.60 per share, and recognized a preferred stock redemption charge of $2.6 million. As of February 4, 2019, 2.3 million shares of our Series D Convertible Preferred Stock were outstanding at a book value aggregating $57.5 million.
- In January 2019, we completed the acquisition of five properties in key submarkets with value-add operating properties. See "Acquisitions" in this Earnings Press Release for additional information.
Select 2018 Highlights
December 31, 2018
Acquisitions | |||||||||||||||||||||
Property | Submarket/Market | Date of | Number of | Operating Occupancy | Square Footage | Purchase Price | |||||||||||||||
Future | Active | Operating With | |||||||||||||||||||
4Q18 Acquisitions: | |||||||||||||||||||||
Alexandria Life Science Factory at Long Island City(1) | New York City/New York City | 10/9/18 | 1 | 100% | — | 140,098 | 36,661 | $ | 75,000 | ||||||||||||
10260 Campus Point Drive and 4161 Campus Point Court | University Town Center/ San Diego | 12/28/18 | 2 | 100% | 378,355 | (2) | — | 269,048 | (2) | 15,000 | (3) | ||||||||||
3 | 378,355 | 140,098 | 305,709 | $ | 90,000 | ||||||||||||||||
(1) | Refer to the "New Class A Development and Redevelopment Properties: Summary of Pipeline" on page 41 of our Supplemental Information for additional information. |
(2) | We acquired two buildings adjacent to our Campus Pointe by Alexandria campus aggregating 269,048 RSF, comprising 109,164 RSF at 10260 Campus Point Drive and 159,884 RSF at 4161 Campus Point Court which are 100% leased through 2022. At lease expiration, 10260 Campus Point Drive will be redeveloped and expanded into a 176,455 RSF Class A building, which is pre-leased 100% for 15 years with the target delivery in 2021. 4161 Campus Point Court will support future development aggregating 201,900 RSF through one or more Class A buildings at our Campus Pointe by Alexandria campus. |
(3) | Total purchase price of $80.0 million was paid in two installments, $15.0 million in December 2018 and $65.0 million in January 2019. |
Property | Submarket/Market | Date of | Number of | Operating Occupancy | Square Footage | Unlevered Yields | Purchase Price | ||||||||||||||||||
Operating With | Operating | Initial | Initial | ||||||||||||||||||||||
2019 Acquisitions: | |||||||||||||||||||||||||
3170 Porter Drive | Greater Stanford/ San Francisco | 1/10/19 | 1 | 100% | — | 98,626 | 7.5% | 5.1% | $ | 100,250 | |||||||||||||||
Shoreway Science Center | Greater Stanford/ San Francisco | 1/10/19 | 2 | 100% | — | 82,462 | 7.2% | 5.5% | 73,200 | ||||||||||||||||
10260 Campus Point Drive and 4161 Campus | University Town Center/ San Diego | N/A | N/A | N/A | N/A | N/A | (1) | (1) | 65,000 | (2) | |||||||||||||||
3911 and 3931 Sorrento Valley Boulevard | Sorrento Mesa/ San Diego | 1/9/19 | 2 | 100% | 53,220 | — | 7.2% | 6.6% | 23,060 | ||||||||||||||||
Remaining targeted acquisitions | 368,490 | ||||||||||||||||||||||||
2019 guidance midpoint | $ | 630,000 | |||||||||||||||||||||||
(1) | We expect to provide total estimated costs and related yields in the future upon the commencement of development and redevelopment. |
(2) | See footnote 3 above. |
Dispositions and Sale of Partial Joint Venture Interest | ||||||||||||||||||||||||
Property | Submarket/Market | Date of Sale | RSF | Sales Price | Sales Price per RSF | Gain | ||||||||||||||||||
4Q18 Disposition: | ||||||||||||||||||||||||
1300 Quince Orchard Boulevard | Gaithersburg/Maryland | 12/13/18 | 54,874 | $ | 14,441 | (1) | $ | 263 | $ | 8,704 | ||||||||||||||
2019 Sale of Partial Joint Venture Interest: | ||||||||||||||||||||||||
75/125 Binney Street (sale of 60% noncontrolling interest)2 | Cambridge/Greater Boston | 1Q19 | 388,270 | $ | 438,000 | $ | 1,880 | (2) | ||||||||||||||||
Targeted Dispositions Guidance Midpoint | 312,000 | |||||||||||||||||||||||
2019 guidance midpoint | $ | 750,000 | ||||||||||||||||||||||
(1) | In April 2018, our tenant exercised its option to purchase this Class B property at fair market value. The capitalization rates for this sale were 6.6% and 7.0% (cash basis). |
(2) | In February 2019, we executed a purchase and sale agreement to sell a 60% interest in 75/125 Binney Street, a Class A property in our Cambridge submarket, for a sales price of $438 million, or $1,880 per RSF, representing a 4.3% capitalization rate on 4Q18 net operating income (cash basis), annualized. The sale of a 60% ownership interest in this joint venture is expected to be accounted for as an equity transaction, with no gain to be recognized in earnings. Closing is expected to occur in 1Q19. Upon completion of the sale, we expect to retain control over the joint venture. We expect to reinvest the proceeds from this sale into our value-creation pipeline. |
Guidance | ||||||||
The following updated guidance is based on our current view of existing market conditions and assumptions for the year ending December 31, 2019. There can be no assurance that actual amounts will not be materially higher or lower than these expectations. See our discussion of "forward-looking statements" on page 8 of this Earnings Press Release for additional information. | ||||||||
Summary of Key Changes in Guidance | Guidance | ||||||||
As of 2/4/19 | As of 11/28/18 | ||||||||
EPS, FFO per share, and FFO per share, as adjusted | See updates below | ||||||||
Capitalization of interest | $72 to $82 | $76 to $86 | |||||||
Projected Earnings per Share and Funds From Operations per Share Attributable to Alexandria's | |||||||||
As of 2/4/19 | As of 11/28/18 | ||||||||
Earnings per share ("EPS")(1) | $1.95 to $2.15 | $2.05 to $2.25 | |||||||
Depreciation and amortization | 4.85 | 4.77 | |||||||
Allocation to unvested restricted stock awards | (0.03) | (0.03) | |||||||
Funds from operations per share(1) | $6.77 to $6.97 | $6.79 to $6.99 | |||||||
Loss on early extinguishment of debt in January 2019 | 0.06 | 0.06 | |||||||
Preferred stock redemption charge in January 2019 | 0.02 | — | |||||||
Funds from operations per share, as adjusted(2) | $6.85 to $7.05 | $6.85 to $7.05 | |||||||
Midpoint | $6.95 | $6.95 | |||||||
Key Assumptions | Low | High | |||||||
Occupancy percentage in North America as of December 31, 2019 | 97.7% | 98.3% | |||||||
Lease renewals and re-leasing of space: | |||||||||
Rental rate increases | 25.0% | 28.0% | |||||||
Rental rate increases (cash basis) | 11.0% | 14.0% | |||||||
Same property performance: | |||||||||
Net operating income increase | 1.0% | 3.0% | |||||||
Net operating income increase (cash basis) | 6.0% | 8.0% | |||||||
Straight-line rent revenue | $ | 95 | $ | 105 | (5) | ||||
General and administrative expenses | $ | 108 | $ | 113 | |||||
Capitalization of interest | $ | 72 | $ | 82 | |||||
Interest expense | $ | 172 | $ | 182 | |||||
Summary of Key Changes in Key Sources and Uses of | Guidance Midpoint | ||||||
Capital Guidance | As of 2/4/19 | As of 11/28/18 | |||||
Common equity | $ | 525 | $ | 625 | |||
Construction | $ | 1,300 | $ | 1,400 | |||
2019 Guidance | |||||||
Key Credit Metrics | |||||||
Net debt to Adjusted EBITDA – 4Q19 annualized | Less than or equal to 5.3x | ||||||
Net debt and preferred stock to Adjusted EBITDA – 4Q19 annualized | Less than or equal to 5.4x | ||||||
Fixed-charge coverage ratio – 4Q19 annualized | Greater than 4.0x | ||||||
Value-creation pipeline as a percentage of gross real estate as of | 8% to 12% | ||||||
December 31, 2019 | |||||||
Key Sources and Uses of Capital | Range | Midpoint | |||||||||||
Sources of capital: | |||||||||||||
Net cash provided by operating activities after dividends | $ | 170 | $ | 210 | $ | 190 | |||||||
Incremental debt | 485 | 445 | 465 | ||||||||||
Real estate dispositions and partial interest sales: | |||||||||||||
Sale of partial interest in core class A property | 438 | 438 | 438 | (3) | |||||||||
Other | 262 | 362 | 312 | (3) | |||||||||
Common equity | 475 | 575 | 525 | ||||||||||
Total sources of capital | $ | 1,830 | $ | 2,030 | $ | 1,930 | |||||||
Uses of capital: | |||||||||||||
Construction | $ | 1,250 | $ | 1,350 | $ | 1,300 | |||||||
Acquisitions | 580 | 680 | 630 | (4) | |||||||||
Total uses of capital | $ | 1,830 | $ | 2,030 | $ | 1,930 | |||||||
Incremental debt (included above): | |||||||||||||
Issuance of unsecured senior notes payable | $ | 600 | $ | 700 | $ | 650 | |||||||
Repayments of secured notes payable | (120) | (130) | (125) | ||||||||||
$2.2 billion unsecured senior line of credit/other | 5 | (125) | (60) | ||||||||||
Incremental debt | $ | 485 | $ | 445 | $ | 465 | |||||||
(1) | Excludes future unrealized gains or losses after December 31, 2018 that are required to be recognized in earnings from changes in fair value of equity investments. |
(2) | Calculated in accordance with standards established by the Advisory Board of Governors of the National Association of Real Estate Investment Trusts (the "Nareit Board of Governors"). See definition of "Funds From Operations and Funds From Operations, As Adjusted, Attributable to Alexandria's Common Stockholders" in the "Definitions and Reconciliations" section of our Supplemental Information for additional information. |
(3) | See "Dispositions and Sale of Partial Joint Venture Interest" in this Earnings Press Release for additional information. |
(4) | See "Acquisitions" in this Earnings Press Release for additional information. |
(5) | Approximately 45% of straight-line rent revenue represents initial free rent on recently delivered and expected 2019 deliveries of new Class A properties from our development and redevelopment pipeline. |
Earnings Call Information and About the Company
December 31, 2018
We will host a conference call on Tuesday, February 5, 2019, at 3:00 p.m. Eastern Time ("ET")/noon Pacific Time ("PT"), which is open to the general public to discuss our financial and operating results for the fourth quarter and year ended December 31, 2018. To participate in this conference call, dial (833) 366-1125 or (412) 902-6738 shortly before 3:00 p.m. ET/noon PT and ask the operator to join the call for Alexandria Real Estate Equities, Inc. The audio webcast can be accessed at www.are.com in the "For Investors" section. A replay of the call will be available for a limited time from 5:00 p.m. ET/2:00 p.m. PT on Tuesday, February 5, 2019. The replay number is (877) 344-7529 or (412) 317-0088, and the access code is 10126730.
Additionally, a copy of this Earnings Press Release and Supplemental Information for the fourth quarter and year ended December 31, 2018, is available in the "For Investors" section of our website at www.are.com or by following this link: http://www.are.com/fs/2018q4.pdf.
For any questions, please contact Joel S. Marcus, executive chairman and founder; Stephen A. Richardson, co-chief executive officer; Peter M. Moglia, co-chief executive officer and co-chief investment officer; Dean A. Shigenaga, co-president and chief financial officer; or Sara M. Kabakoff, assistant vice president – corporate communications, at (626) 578-0777.
About the Company
Alexandria Real Estate Equities, Inc. (NYSE:ARE), an S&P 500® company, is an urban office real estate investment trust ("REIT") uniquely focused on collaborative life science and technology campuses in AAA innovation cluster locations, with a total market capitalization of $18.4 billion and an asset base in North America of 33.1 million square feet ("SF") as of December 31, 2018. The asset base in North America includes 22.4 million RSF of operating properties and 3.9 million RSF of development and redevelopment of new Class A properties currently undergoing construction and pre-construction activities with target delivery dates ranging from 2019 through 2020. Additionally, the asset base in North America includes 6.8 million SF of intermediate-term and future development projects. Founded in 1994, Alexandria pioneered this niche and has since established a significant market presence in key locations, including Greater Boston, San Francisco, New York City, San Diego, Seattle, Maryland, and Research Triangle Park. Alexandria has a longstanding and proven track record of developing Class A properties clustered in urban life science and technology campuses that provide our innovative tenants with highly dynamic and collaborative environments that enhance their ability to successfully recruit and retain world-class talent and inspire productivity, efficiency, creativity, and success. Alexandria also provides strategic capital to transformative life science and technology companies through our venture capital arm. We believe our unique business model and diligent underwriting ensure a high-quality and diverse tenant base that results in higher occupancy levels, longer lease terms, higher rental income, higher returns, and greater long-term asset value. For additional information on Alexandria, please visit www.are.com.
***********
This document includes "forward-looking statements" within the meaning of Section 27A of the Securities Act of 1933, as amended, and Section 21E of the Securities Exchange Act of 1934, as amended. Such forward-looking statements include, without limitation, statements regarding our 2019 earnings per share attributable to Alexandria's common stockholders – diluted, 2019 funds from operations per share attributable to Alexandria's common stockholders – diluted, net operating income, and our projected sources and uses of capital. You can identify the forward-looking statements by their use of forward-looking words, such as "forecast," "guidance," "projects," "estimates," "anticipates," "goals," "believes," "expects," "intends," "may," "plans," "seeks," "should," or "will," or the negative of those words or similar words. These forward-looking statements are based on our current expectations, beliefs, projections, future plans and strategies, anticipated events or trends, and similar expressions concerning matters that are not historical facts, as well as a number of assumptions concerning future events. There can be no assurance that actual results will not be materially higher or lower than these expectations. These statements are subject to risks, uncertainties, assumptions, and other important factors that could cause actual results to differ materially from the results discussed in the forward-looking statements. Factors that might cause such a difference include, without limitation, our failure to obtain capital (debt, construction financing, and/or equity) or refinance debt maturities, increased interest rates and operating costs, adverse economic or real estate developments in our markets, our failure to successfully place into service and lease any properties undergoing development or redevelopment and our existing space held for future development or redevelopment (including new properties acquired for that purpose), our failure to successfully operate or lease acquired properties, decreased rental rates, increased vacancy rates or failure to renew or replace expiring leases, defaults on or non-renewal of leases by tenants, adverse general and local economic conditions, an unfavorable capital market environment, decreased leasing activity or lease renewals, and other risks and uncertainties detailed in our filings with the Securities and Exchange Commission ("SEC"). Accordingly, you are cautioned not to place undue reliance on such forward-looking statements. All forward-looking statements are made as of the date of this Earnings Press Release, and unless otherwise stated, we assume no obligation to update this information and expressly disclaim any obligation to update or revise any forward-looking statements, whether as a result of new information, future events, or otherwise. For more discussion relating to risks and uncertainties that could cause actual results to differ materially from those anticipated in our forward-looking statements, and risks to our business in general, please refer to our SEC filings, including our most recent annual report on Form 10-K and any subsequent quarterly reports on Form 10-Q.
Alexandria®, Lighthouse Design® logo, Building the Future of Life-Changing Innovation™, LaunchLabs®, Alexandria Center®, Alexandria Technology Square®, Alexandria Summit®, Alexandria Technology Center®, and Alexandria Innovation Center® are trademarks of Alexandria Real Estate Equities, Inc. All other company names, trademarks, and logos referenced herein are the property of their respective owners.
Consolidated Statements of Operations | ||||||||||||||||||||||||||||
Three Months Ended | Year Ended | |||||||||||||||||||||||||||
12/31/18 | 9/30/18 | 6/30/18 | 3/31/18 | 12/31/17 | 12/31/18 | 12/31/17 | ||||||||||||||||||||||
Revenues: | ||||||||||||||||||||||||||||
Rental | $ | 260,102 | $ | 255,496 | $ | 250,635 | $ | 244,485 | $ | 228,025 | $ | 1,010,718 | $ | 863,181 | ||||||||||||||
Tenant recoveries | 77,683 | 81,051 | 72,159 | 73,170 | 70,270 | 304,063 | 259,144 | |||||||||||||||||||||
Other income | 2,678 | 5,276 | 2,240 | 2,484 | 496 | 12,678 | 5,772 | |||||||||||||||||||||
Total revenues | 340,463 | 341,823 | 325,034 | 320,139 | 298,791 | 1,327,459 | 1,128,097 | |||||||||||||||||||||
Expenses: | ||||||||||||||||||||||||||||
Rental operations | 97,682 | 99,759 | 91,908 | 91,771 | 88,073 | 381,120 | 325,609 | |||||||||||||||||||||
General and administrative | 22,385 | 22,660 | 22,939 | 22,421 | 18,910 | 90,405 | 75,009 | |||||||||||||||||||||
Interest | 40,239 | 42,244 | 38,097 | 36,915 | 36,082 | 157,495 | 128,645 | |||||||||||||||||||||
Depreciation and amortization | 124,990 | 119,600 | 118,852 | 114,219 | 107,714 | 477,661 | 416,783 | |||||||||||||||||||||
Impairment of real estate | — | — | 6,311 | — | — | 6,311 | 203 | |||||||||||||||||||||
Loss on early extinguishment of debt | — | 1,122 | — | — | 2,781 | 1,122 | 3,451 | |||||||||||||||||||||
Total expenses | 285,296 | 285,385 | 278,107 | 265,326 | 253,560 | 1,114,114 | 949,700 | |||||||||||||||||||||
Equity in earnings of unconsolidated real estate joint ventures | 1,029 | 40,718 | (1) | 1,090 | 1,144 | 376 | 43,981 | 15,426 | ||||||||||||||||||||
Investment (loss) income(2) | (83,531) | (2) | 122,203 | 12,530 | 85,561 | — | 136,763 | (2) | — | |||||||||||||||||||
Gain on sales of real estate – rental properties | 8,704 | — | — | — | — | 8,704 | 270 | |||||||||||||||||||||
Gain on sales of real estate – land parcels | — | — | — | — | — | — | 111 | |||||||||||||||||||||
Net (loss) income | (18,631) | 219,359 | 60,547 | 141,518 | 45,607 | 402,793 | 194,204 | |||||||||||||||||||||
Net income attributable to noncontrolling interests | (6,053) | (5,723) | (5,817) | (5,888) | (6,219) | (23,481) | (25,111) | |||||||||||||||||||||
Net (loss) income attributable to Alexandria Real Estate Equities, Inc.'s | (24,684) | 213,636 | 54,730 | 135,630 | 39,388 | 379,312 | 169,093 | |||||||||||||||||||||
Dividends on preferred stock | (1,155) | (1,301) | (1,302) | (1,302) | (1,302) | (5,060) | (7,666) | |||||||||||||||||||||
Preferred stock redemption charge | (4,240) | — | — | — | — | (4,240) | (11,279) | |||||||||||||||||||||
Net income attributable to unvested restricted stock awards | (1,661) | (3,395) | (1,412) | (1,941) | (1,255) | (6,029) | (4,753) | |||||||||||||||||||||
Net (loss) income attributable to Alexandria Real Estate Equities, Inc.'s | $ | (31,740) | $ | 208,940 | $ | 52,016 | $ | 132,387 | $ | 36,831 | $ | 363,983 | $ | 145,395 | ||||||||||||||
Net (loss) income per share attributable to Alexandria Real Estate | ||||||||||||||||||||||||||||
Basic | $ | (0.30) | $ | 2.01 | $ | 0.51 | $ | 1.33 | $ | 0.39 | $ | 3.53 | $ | 1.59 | ||||||||||||||
Diluted | $ | (0.30) | $ | 1.99 | $ | 0.51 | $ | 1.32 | $ | 0.38 | $ | 3.52 | $ | 1.58 | ||||||||||||||
Weighted-average shares of common stock outstanding: | ||||||||||||||||||||||||||||
Basic | 106,033 | 104,179 | 101,881 | 99,855 | 95,138 | 103,010 | 91,546 | |||||||||||||||||||||
Diluted | 106,033 | 105,385 | 102,236 | 100,125 | 95,914 | 103,321 | 92,063 | |||||||||||||||||||||
Dividends declared per share of common stock | $ | 0.97 | $ | 0.93 | $ | 0.93 | $ | 0.90 | $ | 0.90 | $ | 3.73 | $ | 3.45 | ||||||||||||||
(1) | Includes $35.7 million related to the gain on sale of our remaining 27.5% ownership interest in the unconsolidated real estate joint venture in 360 Longwood Avenue. See "Joint Venture Financial Information" in our Supplemental Information for additional information. |
(2) | See "Investments" in our Supplemental Information for additional information. |
Consolidated Balance Sheets | ||||||||||||||||||||
12/31/18 | 9/30/18 | 6/30/18 | 3/31/18 | 12/31/17 | ||||||||||||||||
Assets | ||||||||||||||||||||
Investments in real estate | $ | 11,913,693 | $ | 11,587,312 | $ | 11,190,771 | $ | 10,671,227 | $ | 10,298,019 | ||||||||||
Investments in unconsolidated real estate joint ventures | 237,507 | 197,970 | 192,972 | 169,865 | 110,618 | |||||||||||||||
Cash and cash equivalents | 234,181 | 204,181 | 287,029 | 221,645 | 254,381 | |||||||||||||||
Restricted cash | 37,949 | 29,699 | 34,812 | 37,337 | 22,805 | |||||||||||||||
Tenant receivables | 9,798 | 11,041 | 8,704 | 11,258 | 10,262 | |||||||||||||||
Deferred rent | 530,237 | 511,680 | 490,428 | 467,112 | 434,731 | |||||||||||||||
Deferred leasing costs | 239,070 | 238,295 | 232,964 | 226,803 | 221,430 | |||||||||||||||
Investments | 892,264 | 957,356 | 790,753 | 724,310 | 523,254 | |||||||||||||||
Other assets | 370,257 | 368,032 | 333,757 | 291,639 | 228,453 | |||||||||||||||
Total assets | $ | 14,464,956 | $ | 14,105,566 | $ | 13,562,190 | $ | 12,821,196 | $ | 12,103,953 | ||||||||||
Liabilities, Noncontrolling Interests, and Equity | ||||||||||||||||||||
Secured notes payable | $ | 630,547 | $ | 632,792 | $ | 776,260 | $ | 775,689 | $ | 771,061 | ||||||||||
Unsecured senior notes payable | 4,292,293 | 4,290,906 | 4,289,521 | 3,396,912 | 3,395,804 | |||||||||||||||
Unsecured senior line of credit | 208,000 | 413,000 | — | 490,000 | 50,000 | |||||||||||||||
Unsecured senior bank term loans | 347,415 | 347,306 | 548,324 | 548,197 | 547,942 | |||||||||||||||
Accounts payable, accrued expenses, and tenant security deposits | 981,707 | 907,094 | 849,274 | 783,986 | 763,832 | |||||||||||||||
Dividends payable | 110,280 | 101,084 | 98,676 | 93,065 | 92,145 | |||||||||||||||
Total liabilities | 6,570,242 | 6,692,182 | 6,562,055 | 6,087,849 | 5,620,784 | |||||||||||||||
Commitments and contingencies | ||||||||||||||||||||
Redeemable noncontrolling interests | 10,786 | 10,771 | 10,861 | 10,212 | 11,509 | |||||||||||||||
Alexandria Real Estate Equities, Inc.'s stockholders' equity: | ||||||||||||||||||||
7.00% Series D cumulative convertible preferred stock | 64,336 | 74,386 | 74,386 | 74,386 | 74,386 | |||||||||||||||
Common stock | 1,110 | 1,058 | 1,033 | 1,007 | 998 | |||||||||||||||
Additional paid-in capital | 7,286,954 | 6,801,150 | 6,387,527 | 6,117,976 | 5,824,258 | |||||||||||||||
Accumulated other comprehensive (loss) income | (10,435) | (3,811) | (2,485) | 1,228 | 50,024 | |||||||||||||||
Alexandria Real Estate Equities, Inc.'s stockholders' equity | 7,341,965 | 6,872,783 | 6,460,461 | 6,194,597 | 5,949,666 | |||||||||||||||
Noncontrolling interests | 541,963 | 529,830 | 528,813 | 528,538 | 521,994 | |||||||||||||||
Total equity | 7,883,928 | 7,402,613 | 6,989,274 | 6,723,135 | 6,471,660 | |||||||||||||||
Total liabilities, noncontrolling interests, and equity | $ | 14,464,956 | $ | 14,105,566 | $ | 13,562,190 | $ | 12,821,196 | $ | 12,103,953 | ||||||||||
Funds From Operations and Funds From Operations per Share | ||||||||||||||||||||||||||||
The following table presents a reconciliation of net (loss) income attributable to Alexandria's common stockholders, the most directly comparable financial measure presented in accordance with generally accepted accounting principles ("GAAP"), including our share of amounts from consolidated and unconsolidated real estate joint ventures, to funds from operations attributable to Alexandria's common stockholders – diluted, and funds from operations attributable to Alexandria's common stockholders – diluted, as adjusted, for the periods below: | ||||||||||||||||||||||||||||
Three Months Ended | Year Ended | |||||||||||||||||||||||||||
12/31/18 | 9/30/18 | 6/30/18 | 3/31/18 | 12/31/17 | 12/31/18 | 12/31/17 | ||||||||||||||||||||||
Net (loss) income attributable to Alexandria's common stockholders – basic | $ | (31,740) | $ | 208,940 | $ | 52,016 | $ | 132,387 | $ | 36,831 | $ | 363,983 | $ | 145,395 | ||||||||||||||
Assumed conversion of 7.00% Series D cumulative convertible preferred stock(1) | — | 1,301 | — | — | — | — | — | |||||||||||||||||||||
Net (loss) income attributable to Alexandria's common stockholders – diluted | (31,740) | 210,241 | 52,016 | 132,387 | 36,831 | 363,983 | 145,395 | |||||||||||||||||||||
Depreciation and amortization | 124,990 | 119,600 | 118,852 | 114,219 | 107,714 | 477,661 | 416,783 | |||||||||||||||||||||
Noncontrolling share of depreciation and amortization from consolidated real estate JVs | (4,252) | (4,044) | (3,914) | (3,867) | (3,777) | (16,077) | (14,762) | |||||||||||||||||||||
Our share of depreciation and amortization from unconsolidated real estate JVs | 719 | 1,011 | 807 | 644 | 432 | 3,181 | 1,551 | |||||||||||||||||||||
Gain on sales of real estate – rental properties | (8,704) | — | — | — | — | (8,704) | (270) | |||||||||||||||||||||
Our share of gain on sales of real estate from unconsolidated real estate JVs(2) | — | (35,678) | — | — | — | (35,678) | (14,106) | |||||||||||||||||||||
Gain on sales of real estate – land parcels | — | — | — | — | — | — | (111) | |||||||||||||||||||||
Impairment of real estate – rental properties | — | — | — | — | — | — | 203 | |||||||||||||||||||||
Assumed conversion of 7.00% Series D cumulative convertible preferred stock(1) | — | — | — | 1,302 | — | 5,060 | — | |||||||||||||||||||||
Allocation to unvested restricted stock awards | — | (1,312) | (1,042) | (1,548) | (734) | (5,961) | (2,920) | |||||||||||||||||||||
Funds from operations attributable to Alexandria's common stockholders – diluted(3) | 81,013 | 289,818 | 166,719 | 243,137 | 140,466 | 783,465 | 531,763 | |||||||||||||||||||||
Unrealized losses (gains) on non-real estate investments | 94,850 | (117,188) | (5,067) | (72,229) | — | (99,634) | — | |||||||||||||||||||||
Realized gains on non-real estate investments | (6,428) | (4) | — | — | (8,252) | — | (14,680) | — | ||||||||||||||||||||
Impairment of real estate – land parcels | — | — | 6,311 | — | — | 6,311 | — | |||||||||||||||||||||
Impairment of non-real estate investments | 5,483 | (4) | — | — | — | 3,805 | 5,483 | 8,296 | ||||||||||||||||||||
Loss on early extinguishment of debt | — | 1,122 | — | — | 2,781 | 1,122 | 3,451 | |||||||||||||||||||||
Our share of gain on early extinguishment of debt from unconsolidated real estate JVs(2) | — | (761) | — | — | — | (761) | — | |||||||||||||||||||||
Preferred stock redemption charge | 4,240 | — | — | — | — | 4,240 | 11,279 | |||||||||||||||||||||
Removal of assumed conversion of 7.00% Series D cumulative convertible preferred stock(1) | — | (1,301) | — | (1,302) | — | (5,060) | — | |||||||||||||||||||||
Allocation to unvested restricted stock awards | (1,138) | 1,889 | (18) | 1,125 | (94) | 1,517 | (321) | |||||||||||||||||||||
Funds from operations attributable to Alexandria's common stockholders – | $ | 178,020 | $ | 173,579 | $ | 167,945 | $ | 162,479 | $ | 146,958 | $ | 682,003 | $ | 554,468 | ||||||||||||||
(1) | See definition of "Weighted-Average Shares of Common Stock Outstanding – Diluted" in the "Definitions and Reconciliations" section of our Supplemental Information for additional information regarding our 7.00% Series D cumulative convertible preferred stock. |
(2) | Classified in equity in earnings (losses) of unconsolidated real estate joint ventures in our consolidated statements of operations. |
(3) | Calculated in accordance with standards established by the Advisory Board of Governors of the National Association of Real Estate Investment Trusts (the "Nareit Board of Governors"). See definition of "Funds From Operations and Funds From Operations, As Adjusted, Attributable to Alexandria's Common Stockholders" in the "Definitions and Reconciliations" section of our Supplemental Information for additional information. |
(4) | Realized gain of $6.4 million relates to one publicly traded non-real estate investment in a biopharmaceutical entity and impairments of $5.5 million primarily relates to one privately held non-real estate investment. Both line items are classified in investment (loss) income in our consolidated statements of operations. Excluding these gains and impairments, our realized gains on non-real estate investments were $10.4 million for the three months ended December 31, 2018. |
Funds From Operations and Funds From Operations per Share (continued) | ||||||||||||||||||||||||||||
The following table presents a reconciliation of net (loss) income per share attributable to Alexandria's common stockholders, the most directly comparable financial measure presented in accordance with GAAP, including our share of amounts from consolidated and unconsolidated real estate joint ventures, to funds from operations per share attributable to Alexandria's common stockholders – diluted, and funds from operations per share attributable to Alexandria's common stockholders – diluted, as adjusted, for the periods below. Per share amounts may not add due to rounding. | ||||||||||||||||||||||||||||
Three Months Ended | Year Ended | |||||||||||||||||||||||||||
12/31/18 | 9/30/18 | 6/30/18 | 3/31/18 | 12/31/17 | 12/31/18 | 12/31/17 | ||||||||||||||||||||||
Net (loss) income per share attributable to Alexandria Real Estate Equities, Inc.'s | $ | (0.30) | $ | 1.99 | $ | 0.51 | $ | 1.32 | $ | 0.38 | $ | 3.52 | $ | 1.58 | ||||||||||||||
Depreciation and amortization | 1.14 | 1.11 | 1.13 | 1.08 | 1.08 | 4.50 | 4.35 | |||||||||||||||||||||
Gain on sale of real estate – rental properties | (0.08) | — | — | — | — | (0.08) | — | |||||||||||||||||||||
Our share of gain on sales of real estate from unconsolidated real estate JVs | — | (0.34) | — | — | — | (0.35) | (0.15) | |||||||||||||||||||||
Assumed conversion of 7.00% Series D cumulative convertible preferred stock(1) | — | — | — | 0.01 | — | — | (2) | — | ||||||||||||||||||||
Allocation to unvested restricted stock awards | — | (0.01) | (0.01) | — | — | (0.06) | — | |||||||||||||||||||||
Funds from operations per share attributable to Alexandria's common | 0.76 | 2.75 | 1.63 | 2.41 | 1.46 | 7.53 | 5.78 | |||||||||||||||||||||
Unrealized losses (gains) on non-real estate investments | 0.89 | (1.11) | (0.05) | (0.70) | — | (0.96) | — | |||||||||||||||||||||
Realized gains on non-real estate investments | (0.06) | (4) | — | — | (0.08) | — | (0.14) | — | ||||||||||||||||||||
Impairment of real estate – land parcels | — | — | 0.06 | — | — | 0.06 | — | |||||||||||||||||||||
Impairment of non-real estate investments | 0.05 | (4) | — | — | — | 0.04 | 0.05 | 0.09 | ||||||||||||||||||||
Loss on early extinguishment of debt | — | 0.01 | — | — | 0.03 | 0.01 | 0.03 | |||||||||||||||||||||
Our share of gain on early extinguishment of debt from unconsolidated real estate | — | (0.01) | — | — | — | (0.01) | — | |||||||||||||||||||||
Preferred stock redemption charge | 0.04 | — | — | — | — | 0.04 | 0.12 | |||||||||||||||||||||
Removal of assumed conversion of 7.00% Series D cumulative convertible | — | — | — | (0.01) | — | — | — | |||||||||||||||||||||
Allocation to unvested restricted stock awards | — | 0.02 | — | — | — | 0.02 | — | |||||||||||||||||||||
Funds from operations per share attributable to Alexandria's common | $ | 1.68 | $ | 1.66 | $ | 1.64 | $ | 1.62 | $ | 1.53 | $ | 6.60 | $ | 6.02 | ||||||||||||||
Weighted-average shares of common stock outstanding(1) for calculations of: | ||||||||||||||||||||||||||||
Earnings per share – diluted | 106,033 | 105,385 | 102,236 | 100,125 | 95,914 | 103,321 | 92,063 | |||||||||||||||||||||
Funds from operations – diluted, per share | 106,244 | 105,385 | 102,236 | 100,866 | 95,914 | 104,048 | 92,063 | |||||||||||||||||||||
Funds from operations – diluted, as adjusted, per share | 106,244 | 104,641 | 102,236 | 100,125 | 95,914 | 103,321 | 92,063 | |||||||||||||||||||||
(1) | See footnote 1 on the previous page for additional information. |
(2) | The assumed conversion of our 7.00% Series D cumulative convertible preferred stock required the addition of $5.1 million of dividends on preferred stock to the numerator, and the addition of 727 thousand shares to the denominator while calculating funds from operations per share attributable to Alexandria's common stockholders – diluted. These amounts had approximately no dilutive impact on a per share basis. |
(3) | Calculated in accordance with standards established by the Nareit Board of Governors. See definition of "Funds From Operations and Funds From Operations, As Adjusted, Attributable to Alexandria's Common Stockholders" in the "Definitions and Reconciliations" section of our Supplemental Information for additional information. |
(4) | See footnote 4 on the previous page for additional information. |
![]() View original content to download multimedia:http://www.prnewswire.com/news-releases/alexandria-real-estate-equities-inc-reports-2018-revenues-of-1-3-billion-up-17-7-over-2017-4q18-loss-per-share--diluted-of-0-30-and-2018-eps--diluted-of-3-52-4q18-and-2018-ffo--diluted-as-adjusted-per-share-of-1--300789317.html
View original content to download multimedia:http://www.prnewswire.com/news-releases/alexandria-real-estate-equities-inc-reports-2018-revenues-of-1-3-billion-up-17-7-over-2017-4q18-loss-per-share--diluted-of-0-30-and-2018-eps--diluted-of-3-52-4q18-and-2018-ffo--diluted-as-adjusted-per-share-of-1--300789317.html
SOURCE Alexandria Real Estate Equities, Inc.

Please make the indicated changes including the new text: US quotes snapshot data provided by IEX. Additional price data and company information powered by Twelve Data.