
CoreLogic Reports March Home Prices Increased by 4.5% Year Over Year
CoreLogic® (NYSE: CLGX), a leading global property information, analytics and data-enabled solutions provider, today released the CoreLogic Home Price Index (HPI™) and HPI Forecast™ for March 2020. Home prices increased nationally by 4.5% from March 2019. On a month-over-month basis, prices increased by 1.3% in March 2020. CoreLogic HPI Forecast indicates annual price growth of 0.5% from March 2020 to March 2021, with a month-over-month increase of 0.6% between March and April 2020.
This press release features multimedia. View the full release here: https://www.businesswire.com/news/home/20200505005172/en/
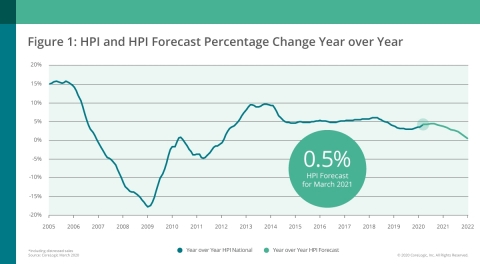
CoreLogic National Home Price Change and Forecast; March 2020 (Graphic: Business Wire)
Increased homes sales in January and February 2020 accounts for the sustained acceleration of home prices seen in the March HPI. CoreLogic continues to monitor shifts in the housing market and economy in light of COVID-19, and, in the coming weeks, homebuying activity will likely continue to be tempered by unemployment and recommended ongoing social distancing practices. We can expect to see home price growth slow drastically in response to this declining demand, with the HPI Forecast predicting less than 1% annual increase in home prices by March 2021.
“Home prices for March reflect transactions negotiated primarily in the previous two months, prior to the implementation of the shelter-in-place policies. Rapid decline of purchase activity starting in the middle of March can be seen in other CoreLogic data and is consistent with our HPI forecast of slowing price growth in April,” said Dr. Frank Nothaft, chief economist at CoreLogic. “The first quarter GDP results showed that the country entered a recession in March. Unemployment claims have reached record highs and this economic environment will further impact the housing market into the foreseeable future.”
According to the CoreLogic Market Condition Indicators (MCI), an analysis of housing values in the country’s 50 largest metropolitan areas based on housing stock, 36% of metropolitan areas had an overvalued housing market in March 2020, while 28% were undervalued and 36% were at value.
The HPI Forecast shows the increased disparity of home prices across metros and highlights the continued housing affordability crisis, which began well before COVID-19 and promises to deepen in the looming recession. In overvalued markets like Houston, where the recent oil and gas industry is in turmoil, home prices are expected to decline by 2.6%. Similarly, Miami single-family combined home prices are projected to decrease by 1.9% by March 2021 where the current market is overvalued.
The nationwide HPI of single-family attached (condos, duplexes), the more affordable housing option, increased by 3.8% year over year in March 2020, whereas the single-family detached, increased in March by 4.7% year over year. Before COVID-19, a booming economy and increased wages had many home buyers taking advantage of low rates and choosing to purchase larger detached options, which pushed home prices up almost a full 1% over smaller condo or duplex options.
“The CoreLogic U.S. Home Price Index is predicted to remain largely unchanged over the next year or so after a long uninterrupted run of appreciation,” said Frank Martell, president and CEO of CoreLogic. “Although the economic fallout from lockdown orders, put in place to fight the spread of COVID-19, will be profound, the basic supports for a rebound in home purchase activity remain in place. Once the shelter-in-place policies are lifted, we expect millennials, who submitted home-purchase applications well into the crisis, to lead the way back to a positive, purchase-driven housing cycle.”
The next CoreLogic HPI press release, featuring April 2020 data, will be issued on June 2 at 8:00 a.m. ET
Methodology
The CoreLogic HPI™ is built on industry-leading public record, servicing and securities real-estate databases and incorporates more than 40 years of repeat-sales transactions for analyzing home price trends. Generally released on the first Tuesday of each month with an average five-week lag, the CoreLogic HPI is designed to provide an early indication of home price trends by market segment and for the “Single-Family Combined” tier, representing the most comprehensive set of properties, including all sales for single-family attached and single-family detached properties. The indices are fully revised with each release and employ techniques to signal turning points sooner. The CoreLogic HPI provides measures for multiple market segments, referred to as tiers, based on property type, price, time between sales, loan type (conforming vs. non-conforming) and distressed sales. Broad national coverage is available from the national level down to ZIP Code, including non-disclosure states.
CoreLogic HPI Forecasts™ are based on a two-stage, error-correction econometric model that combines the equilibrium home price—as a function of real disposable income per capita—with short-run fluctuations caused by market momentum, mean-reversion, and exogenous economic shocks like changes in the unemployment rate. With a 30-year forecast horizon, CoreLogic HPI Forecasts project CoreLogic HPI levels for two tiers — “Single-Family Combined” (both attached and detached) and “Single-Family Combined Excluding Distressed Sales.” As a companion to the CoreLogic HPI Forecasts, Stress-Testing Scenarios align with Comprehensive Capital Analysis and Review (CCAR) national scenarios to project five years of home prices under baseline, adverse and severely adverse scenarios at state, metropolitan areas and ZIP Code levels. The forecast accuracy represents a 95% statistical confidence interval with a +/- 2% margin of error for the index.
About the Market Condition Indicators
As part of the CoreLogic HPI and HPI Forecasts offerings, Market Condition Indicators are available for all metropolitan areas and identify individual markets as “overvalued”, “at value”, or “undervalued.” These indicators are derived from the long-term fundamental values, which are a function of real disposable income per capita. Markets are labeled as overvalued if the current home price indexes exceed their long-term values by greater than 10%, and undervalued where the long-term values exceed the index levels by greater than 10%.
Source: CoreLogic
The data provided are for use only by the primary recipient or the primary recipient's publication or broadcast. This data may not be resold, republished or licensed to any other source, including publications and sources owned by the primary recipient’s parent company without prior written permission from CoreLogic. Any CoreLogic data used for publication or broadcast, in whole or in part, must be sourced as coming from CoreLogic, a data and analytics company. For use with broadcast or web content, the citation must directly accompany first reference of the data. If the data are illustrated with maps, charts, graphs or other visual elements, the CoreLogic logo must be included on screen or website. For questions, analysis or interpretation of the data, contact Allyse Sanchez at [email protected]. Data provided may not be modified without the prior written permission of CoreLogic. Do not use the data in any unlawful manner. The data are compiled from public records, contributory databases and proprietary analytics, and its accuracy is dependent upon these sources.
About CoreLogic
CoreLogic (NYSE: CLGX), the leading provider of property insights and solutions, promotes a healthy housing market and thriving communities. Through its enhanced property data solutions, services and technologies, CoreLogic enables real estate professionals, financial institutions, insurance carriers, government agencies and other housing market participants to help millions of people find, acquire and protect their homes. For more information, please visit www.corelogic.com.
CORELOGIC, the CoreLogic logo, CoreLogic HPI and CoreLogic HPI Forecast are trademarks of CoreLogic, Inc. and/or its subsidiaries. All other trademarks are the property of their respective owners.
View source version on businesswire.com: https://www.businesswire.com/news/home/20200505005172/en/
Allyse Sanchez
INK Communications
925-548-2535
[email protected]
Please make the indicated changes including the new text: US quotes snapshot data provided by IEX. Additional price data and company information powered by Twelve Data.