
iStar Announces Third Quarter 2016 Results
iStar Announces Third Quarter 2016 Results
- Net income grew to $0.44 per diluted common share from a loss of $(0.07) in the third quarter of last year.
- Adjusted income grew to $0.47 per diluted common share from $0.25 in the third quarter of last year.
PR Newswire
NEW YORK, Nov. 3, 2016
NEW YORK, Nov. 3, 2016 /PRNewswire/ -- iStar (NYSE: STAR) today reported results for the third quarter ended September 30, 2016.
Third Quarter 2016 Results
iStar reported net income allocable to common shareholders for the third quarter of $46.3 million, or $0.44 per diluted common share and $0.65 per basic common share. This compares favorably to a loss of $(6.1) million, or $(0.07) per diluted and basic common share for the third quarter 2015.
Adjusted income allocable to common shareholders for the third quarter was $49.1 million, or $0.47 per diluted common share and $0.69 per basic common share. This represents over a 70% increase from the $27.3 million, or $0.25 per diluted common share and $0.32 per basic common share reported for the third quarter 2015.
Adjusted income represents net income computed in accordance with GAAP, prior to the effects of certain non-cash items. Please see the financial tables that follow the text of this press release for the Company's calculations of adjusted income and reconciliation to GAAP net income (loss).
Investment Activity
During the quarter, the Company originated $301.1 million of new investments bringing total originations year to date to $459.3 million. During the quarter, iStar funded a total of $165.5 million associated with new investments, prior financing commitments and ongoing development across its four segments, bringing the total fundings year to date to $489.4 million. In addition, the portfolio generated $262.2 million of repayments and sales during the quarter, bringing total proceeds received to $854.5 million year to date.
|
3Q'16 Investing Activity | ||||||||||||||
|
$ in millions | ||||||||||||||
|
Real Estate |
Net |
Operating |
Land & |
Corporate |
Total | |||||||||
|
Originated |
$83.0 |
$218.1 |
— |
— |
— |
$301.1 | ||||||||
|
Invested |
$85.4 |
$36.5 |
$15.9 |
$27.5 |
$0.2 |
$165.5 | ||||||||
|
Proceeds received |
$49.1 |
$78.8 |
$85.8 |
$42.5 |
$6.0 |
$262.2 | ||||||||
|
Note: Originated represents total commitments on new investments made during the quarter. Invested represents | ||||||||||||||
New originations within our real estate finance portfolio are expected to generate a weighted average unlevered IRR of 11.9%, while the net lease originations within our net lease fund are expected to generate a 10.3% IRR on our equity contributions.(1)
Portfolio Overview
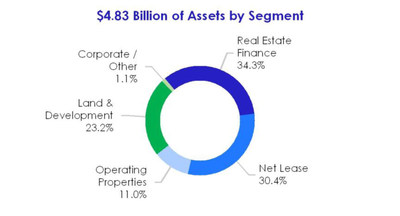
At September 30, 2016, the Company's portfolio totaled $4.83 billion, which is gross of $412.1 million of accumulated depreciation and $21.2 million of general loan loss reserves.
|
_______________________ |
|
(1) IRRs are based on contractual investment terms such as coupon, rent and term. The Company makes assumptions |
A summary of quarterly activity is below:
|
Portfolio Rollforward | |||||||||||||||||||||||
|
$ in millions | |||||||||||||||||||||||
|
Real |
Net |
Operating |
Land & |
Corporate |
Total | ||||||||||||||||||
|
Net book value (6/30/16) |
$ |
1,568.5 |
$ |
1,149.7 |
$ |
493.2 |
$ |
1,134.9 |
$ |
58.9 |
$ |
4,405.2 |
|||||||||||
|
Investments |
85.4 |
36.5 |
15.9 |
27.5 |
0.2 |
165.5 |
|||||||||||||||||
|
Asset transfers between |
(9.1) |
— |
36.3 |
(27.2) |
— |
— |
|||||||||||||||||
|
Principal received / basis |
(49.1) |
(74.1) |
(56.5) |
(37.0) |
(9.0) |
(225.7) |
|||||||||||||||||
|
Other |
36.5 |
(6.9) |
(1.8) |
16.8 |
3.3 |
47.9 |
|||||||||||||||||
|
Net book value (9/30/16) |
1,632.2 |
1,105.2 |
487.1 |
1,115.0 |
53.4 |
4,392.9 |
|||||||||||||||||
|
Add: Accumulated |
21.2 |
362.3 |
42.9 |
6.9 |
— |
433.3 |
|||||||||||||||||
|
Gross book value (9/30/16) |
$ |
1,653.4 |
$ |
1,467.5 |
$ |
530.0 |
$ |
1,121.9 |
$ |
53.4 |
$ |
4,826.2 |
|||||||||||
|
Note: Gross book value is based on carrying value of the Company's total investment portfolio, gross of accumulated depreciation and | |||||||||||||||||||||||
Real Estate Finance
iStar's real estate finance business targets sophisticated and innovative investors by providing one-stop capabilities that encompass financial alternatives ranging from full envelope senior loans to custom-tailored mezzanine and preferred equity capital positions.
At September 30, 2016, the Company's real estate finance portfolio totaled $1.65 billion, gross of general loan loss reserves. The portfolio is categorized into iStar 3.0 loans, made post January 1, 2008, and legacy loans, which were all made prior to December 31, 2007.
The following table summarizes statistics for our real estate finance portfolio:
|
Real Estate Finance Statistics | |||||||||||||||||||
|
$ in millions | |||||||||||||||||||
|
iStar 3.0 |
Legacy | ||||||||||||||||||
|
Q3'16 |
Q2'16 |
Q3'15 |
Q3'16 |
Q2'16 |
Q3'15 | ||||||||||||||
|
Gross book value |
$ |
1,365.9 |
$ |
1,306.2 |
$ |
1,141.8 |
$ |
287.5 |
$ |
299.2 |
$ |
476.6 |
|||||||
|
% of total loan portfolio |
83% |
81% |
71% |
17% |
19% |
29% |
|||||||||||||
|
Performing loans |
$ |
1,365.9 |
$ |
1,306.2 |
$ |
1,141.8 |
$ |
65.0 |
$ |
219.7 |
$ |
394.0 |
|||||||
|
Non-performing loans |
$ |
— |
$ |
— |
$ |
— |
$ |
222.5 |
$ |
79.5 |
$ |
82.6 |
|||||||
|
% Performing / Non-performing |
100% / 0% |
100% / 0% |
100% / 0% |
23% / 77% |
73% / 27% |
83% / 17% |
|||||||||||||
|
First mortgages / senior loans |
72% |
70% |
64% |
44% |
43% |
32% |
|||||||||||||
|
Mezzanine / subordinated debt |
28% |
30% |
36% |
56% |
57% |
68% |
|||||||||||||
|
Total |
100% |
100% |
100% |
100% |
100% |
100% |
|||||||||||||
|
Wtd. avg. LTV |
61.5% |
61.5% |
59.5% |
89.9% |
90.1% |
90.8% |
|||||||||||||
|
Weighted avg. risk rating |
2.61 |
3.08 |
2.93 |
4.30 |
3.88 |
3.73 |
|||||||||||||
|
Note: Gross book value represents the carrying value of iStar's loans, gross of general reserves. Risk rating and LTVs based on | |||||||||||||||||||
The $1.43 billion of performing loans had a weighted average maturity of 1.6 years and generated a 9.1% unlevered yield for the quarter.
At September 30, 2016, the Company's non-performing loans (NPLs) were exclusively derived from its legacy loan portfolio with a carrying value of $222.5 million, up from $79.5 million in the second quarter. The $143.0 million sequential increase was related to a loan, secured in part by pledges of equity in a portfolio of hotels and recourse to the borrower, which ceased paying current interest after the borrower and most of its related entities filed for bankruptcy protection during the third quarter.
Net Lease
iStar's net lease business seeks to create stable cash flows through long-term leases to single tenants on its properties. The Company targets mission-critical facilities leased on a long-term basis to tenants, offering structured solutions that combine iStar's capabilities in underwriting, lease structuring, asset management and build-to-suit construction. The Company invests in new net lease investments primarily through its net lease joint venture, in which iStar holds a 52% interest. The joint venture has a right of first offer on any new net lease investments that iStar sources.
At the end of the quarter, iStar's net lease portfolio totaled $1.47 billion, gross of $362.3 million of accumulated depreciation.
|
Net Lease Portfolio Overview | ||
|
$ in millions | ||
|
Wholly owned assets |
$1,364.1 | |
|
Joint venture investments (1) |
103.4 | |
|
Total |
$1,467.5 | |
|
(1) Represents iStar's 52% interest within its net lease | ||
During the quarter, the Company's net lease JV closed on two new transactions totaling $218.1 million. The venture funded $68.6 million during the quarter, of which iStar contributed $35.9 million. The Company's interest and commitment to JV deals within the fund is 52% of equity.
Same store net operating income for the net lease portfolio was $31.1 million for the quarter versus $29.7 million for same quarter last year. This quarter, the Company executed leases on net lease assets totaling approximately 190,000 square feet. In addition, the Company received $78.8 million of sales proceeds from its net lease portfolio and recorded gains of $6.6 million.
|
Net Lease Statistics | ||||||
|
Q3'16 |
Q2'16 |
Q3'15 | ||||
|
Square feet (000s) |
17,022 |
17,348 |
18,174 |
|||
|
% Leased |
99% |
98% |
96% |
|||
|
Wtd. avg. lease term (yrs) |
14.6 |
14.6 |
14.8 |
|||
|
Yield |
8.2% |
8.2% |
7.8% |
|||
Operating Properties
At the end of the quarter, iStar's operating property portfolio totaled $530.0 million, gross of $42.9 million of accumulated depreciation, and was comprised of $428.5 million of commercial and $101.5 million of residential real estate properties. During the quarter, the Company invested $15.9 million within its operating properties portfolio and received $85.8 million of proceeds from sales. These sales generated $27.8 million of gains.
Commercial Operating Properties
The Company's commercial operating properties represent a diverse pool of assets across a broad range of geographies and collateral types including office, retail and hotel properties. These properties generated $25.6 million of revenue offset by $18.9 million of expenses during the quarter. At the end of the quarter, the Company had $243.8 million of stabilized assets and $184.7 million of transitional assets. iStar generally seeks to reposition these assets with the objective of maximizing their values through the infusion of capital and/or intensive asset management efforts resulting in value realization upon sale. The Company has made significant progress on this goal, having either stabilized or sold approximately $350 million of its transitional operating properties over the past year.
|
Commercial Operating Property Statistics | |||||||||||
|
$ in millions | |||||||||||
|
Stabilized Operating |
Transitional Operating |
Total | |||||||||
|
Q3'16 |
Q2'16 |
Q3'15 |
Q3'16 |
Q2'16 |
Q3'15 |
Q3'16 |
Q2'16 |
Q3'15 | |||
|
Gross book value |
$243.8 |
$149.3 |
$111.8 |
$184.7 |
$277.8 |
$461.3 |
$428.5 |
$427.1 |
$573.1 | ||
|
% of total |
57% |
35% |
20% |
43% |
65% |
80% |
100% |
100% |
100% | ||
|
Occupancy |
86% |
86% |
87% |
55% |
63% |
59% |
72% |
73% |
68% | ||
|
Yield |
8.4% |
8.2% |
7.8% |
2.4% |
3.2% |
2.7% |
5.9% |
4.6% |
3.7% | ||
During the quarter, the Company sold one stabilized (mixed-use) and two transitional (office and retail) commercial operating properties for $70.2 million of proceeds, recognizing $23.4 million of gains. The sales were executed at a weighted average trailing twelve month cap rate of 5.6%.
As a result of successful leasing activity, the Company reclassified four transitional properties as stabilized this quarter. In addition, the Company migrated two completed projects from its land & development portfolio, The Asbury hotel and 1000 South Clark, into its stabilized and transitional commercial operating properties portfolios, respectively, this quarter.
Residential Operating Properties
At the end of the quarter, the $101.5 million residential operating portfolio was comprised of 58 condominium units generally located within luxury projects in major U.S. cities.
|
Residential Operating Property Statistics | ||||||
|
$ in millions | ||||||
|
Q3'16 |
Q2'16 |
Q3'15 | ||||
|
Condominium units sold |
11 |
55 |
21 |
|||
|
Proceeds |
$15.4 |
$38.7 |
$24.4 |
|||
|
Income |
$4.6 |
$14.3 |
$6.8 |
|||
Land & Development
At the end of the quarter, the Company's land & development portfolio totaled $1.12 billion, with eight projects in production, nine in development and 14 in the pre-development phase. These projects are collectively entitled for approximately 30,000 lots and units.
|
Land & Development Portfolio Overview as of 9/30/16 | ||||||||
|
$ in millions | ||||||||
|
MPCs |
Waterfront |
Urban / Infill |
Total |
|||||
|
# of projects |
11 |
6 |
14 |
31 |
||||
|
In production |
$190.1 |
$138.9 |
$55.2 |
$384.2 |
||||
|
In development |
252.0 |
135.4 |
21.6 |
409.0 |
||||
|
Pre-development |
226.4 |
7.6 |
94.7 |
328.7 |
||||
|
Gross book value |
$668.5 |
$281.9 |
$171.5 |
$1,121.9 |
||||
|
Land & Development Activity for 3Q'16 | ||||||||
|
Land development revenue |
$10.2 |
$8.3 |
$13.1 |
$31.6 |
||||
|
Land development cost of sales |
(7.7) |
(4.0) |
(10.3) |
(22.0) |
||||
|
Gross margin |
$2.5 |
$4.3 |
$2.8 |
$9.6 |
||||
|
Earnings from land development |
0.1 |
6.2 |
15.5 |
21.8 |
||||
|
Total |
$2.6 |
$10.5 |
$18.3 |
$31.4 |
||||
|
Capital expenditures / Contributions |
$16.2 |
$5.9 |
$5.4 |
$27.5 |
||||
iStar and its joint venture partner closed on a $145.0 million refinancing of 1000 South Clark, a 469-unit multifamily project located in Chicago's South Loop neighborhood. The refinancing resulted in the repayment of iStar's $38.9 million mezzanine loan on 1000 South Clark, an $18.3 million equity distribution to iStar resulting in a reduction of the asset's basis to zero and $15.8 million of earnings from equity method investments. Post refinancing, the Company's equity interest in the joint venture is 50%. At the end of the quarter, the Company moved the asset into its transitional commercial operating properties portfolio.
In addition, the Company reclassified The Asbury, the recently completed $45 million boutique hotel anchoring iStar's Asbury Park Waterfront development, as a stabilized commercial operating property.
Capital Markets
The Company is capitalized with debt, preferred stock and common equity.
The Company's weighted average cost of debt for the third quarter was 5.6%. The Company's leverage was 2.1x at the end of the quarter, within the Company's targeted range of 2.0x – 2.5x.
|
Leverage at 9/30/16 | ||||||
|
$ in millions |
||||||
|
Book Debt |
$3,749.9 |
Book equity (1) |
$1,071.5 |
|||
|
Less: Cash and cash equivalents |
(547.5) |
Add: Accumulated depreciation and |
461.7 |
|||
|
Net book debt (A) |
$3,202.4 |
Add: General loan loss reserves |
21.2 |
|||
|
Sum of book equity, accumulated D&A |
$1,554.4 |
|||||
|
Leverage (A) / (B) |
2.1x |
|||||
|
(1) Includes $699.7 million of preferred equity. | ||||||
|
(2) Accumulated depreciation and amortization includes iStar's proportionate share of accumulated depreciation and | ||||||
The Company upsized its 2016 Secured Term Loan by $50.0 million during the quarter, bringing the outstanding balance to $500 million. Proceeds from the upsize were used to repay outstanding borrowings under our revolving credit facility, leaving the $250 million facility fully undrawn.
During the quarter, the Company repurchased at par $21.8 million of its 1.5% convertible notes due in November, which equates to a reduction of 1.3 million diluted shares.
|
Shares Outstanding | |||||||
|
in millions |
|||||||
|
Q3'16 |
Q2'16 |
Q3'15 | |||||
|
Basic shares outstanding at end of period |
71.2 |
71.9 |
85.2 |
||||
|
3.0% convertible notes / strike of $11.77 (if converted) (1) |
17.0 |
17.0 |
17.0 |
||||
|
1.5% convertible notes / strike of $17.29 (if converted) (1) |
10.3 |
11.6 |
11.6 |
||||
|
4.5% Series J conv. preferred / strike of $12.79 (if converted) |
15.6 |
15.6 |
15.6 |
||||
|
Other securities |
0.8 |
0.8 |
0.8 |
||||
|
Diluted shares outstanding at end of period |
114.9 |
116.9 |
130.2 |
||||
|
(1) Matures November 15, 2016 |
|||||||
Liquidity
At the end of the quarter, iStar had a combined $797.5 million of unrestricted cash and available capacity on its revolving credit facility. The Company expects to maintain larger liquidity balances in anticipation of retiring up to $378.3 million of remaining convertible bonds due on November 15, 2016. Aside from these convertible bonds, the Company has an additional $374.7 million of debt maturities over the next four quarters.
|
Liquidity at 9/30/16 | |
|
$ in millions | |
|
Unrestricted cash |
$547.5 |
|
Revolving credit facility capacity |
$250.0 |
|
Total liquidity |
$797.5 |
* * *
iStar (NYSE: STAR) finances, invests in and develops real estate and real estate related projects as part of its fully-integrated investment platform. Building on over two decades of experience and more than $35 billion of transactions, iStar brings uncommon capabilities and new ways of thinking to commercial real estate and adapts its investment strategy to changing market conditions. The Company is structured as a real estate investment trust ("REIT"), with a diversified portfolio focused on larger assets located in major metropolitan markets.
iStar will hold a quarterly earnings conference call at 10:00 a.m. ET today, November 3, 2016. This conference call will be broadcast live over the internet and can be accessed by all interested parties through iStar's website, www.istar.com. To listen to the live call, please go to the website's "Investor" section at least 15 minutes prior to the start of the call to register, download and install any necessary audio software. For those who are not available to listen to the live broadcast, a replay will be available shortly after the call on iStar's website.
Note: Statements in this press release which are not historical fact may be deemed forward-looking statements within the meaning of Section 27A of the Securities Act of 1933 and Section 21E of the Securities Exchange Act of 1934. Although iStar believes the expectations reflected in any forward-looking statements are based on reasonable assumptions, the Company can give no assurance that its expectations will be attained. Factors that could cause actual results to differ materially from iStar's expectations include general economic conditions and conditions in the commercial real estate and credit markets, the Company's ability to generate liquidity and to repay indebtedness as it comes due, additional loan loss provisions, the amount and timing of asset sales, changes in NPLs, repayment levels, the Company's ability to make new investments, the Company's ability to maintain compliance with its debt covenants, the Company's ability to generate income and gains from operating properties and land and other risks detailed from time to time in iStar SEC reports.

|
iStar | ||||||||||||||||
|
Consolidated Statements of Operations | ||||||||||||||||
|
(In thousands) | ||||||||||||||||
|
(unaudited) | ||||||||||||||||
|
Three Months |
Nine Months | |||||||||||||||
|
2016 |
2015 |
2016 |
2015 | |||||||||||||
|
REVENUES |
||||||||||||||||
|
Operating lease income |
$ |
51,414 |
$ |
55,699 |
$ |
160,869 |
$ |
170,990 |
||||||||
|
Interest income |
32,258 |
33,599 |
99,877 |
102,224 |
||||||||||||
|
Other income |
13,442 |
16,888 |
35,080 |
40,214 |
||||||||||||
|
Land development revenue |
31,554 |
14,301 |
74,389 |
29,101 |
||||||||||||
|
Total revenues |
$ |
128,668 |
$ |
120,487 |
$ |
370,215 |
$ |
342,529 |
||||||||
|
COST AND EXPENSES |
||||||||||||||||
|
Interest expense |
$ |
55,105 |
$ |
56,880 |
$ |
168,173 |
$ |
167,336 |
||||||||
|
Real estate expense |
35,335 |
35,154 |
105,078 |
111,143 |
||||||||||||
|
Land development cost of sales |
22,004 |
10,686 |
50,842 |
22,828 |
||||||||||||
|
Depreciation and amortization |
13,002 |
15,787 |
42,184 |
49,804 |
||||||||||||
|
General and administrative(1) |
19,666 |
21,181 |
62,433 |
62,520 |
||||||||||||
|
(Recovery of) provision for loan losses |
(14,955) |
7,500 |
(12,749) |
30,944 |
||||||||||||
|
Impairment of assets |
8,741 |
3,916 |
11,753 |
5,590 |
||||||||||||
|
Other expense |
819 |
3,334 |
4,741 |
6,345 |
||||||||||||
|
Total costs and expenses |
$ |
139,717 |
$ |
154,438 |
$ |
432,455 |
$ |
456,510 |
||||||||
|
Income (loss) before other items |
$ |
(11,049) |
$ |
(33,951) |
$ |
(62,240) |
$ |
(113,981) |
||||||||
|
Income from sales of real estate |
34,444 |
26,511 |
88,387 |
66,021 |
||||||||||||
|
Earnings from equity method investments |
26,540 |
10,572 |
74,254 |
25,904 |
||||||||||||
|
Income tax benefit (expense) |
8,256 |
2,893 |
9,859 |
(3,796) |
||||||||||||
|
Loss on early extinguishment of debt |
(36) |
(67) |
(1,618) |
(279) |
||||||||||||
|
Net income (loss) |
$ |
58,155 |
$ |
5,958 |
$ |
108,642 |
$ |
(26,131) |
||||||||
|
Net (income) loss attributable to noncontrolling |
967 |
706 |
(6,915) |
3,176 |
||||||||||||
|
Net income (loss) attributable to iStar |
$ |
59,122 |
$ |
6,664 |
$ |
101,727 |
$ |
(22,955) |
||||||||
|
Preferred dividends |
(12,830) |
(12,830) |
(38,490) |
(38,490) |
||||||||||||
|
Net (income) loss allocable to HPU holders and |
— |
94 |
(27) |
1,627 |
||||||||||||
|
Net income (loss) allocable to common shareholders |
$ |
46,292 |
$ |
(6,072) |
$ |
63,210 |
$ |
(59,818) |
||||||||
|
________________________________________________________________ | ||||||||||||||||
|
(1) For the three months ended September 30, 2016 and 2015, includes $1,434 and $2,881 of stock-based compensation expense, | ||||||||||||||||
|
(2) HPU Holders were current and former Company employees who purchased high performance common stock units under the Company's | ||||||||||||||||
|
iStar | ||||||||||||||||
|
Earnings Per Share Information | ||||||||||||||||
|
(In thousands, except per share data) | ||||||||||||||||
|
(unaudited) | ||||||||||||||||
|
Three Months |
Nine Months | |||||||||||||||
|
2016 |
2015 |
2016 |
2015 | |||||||||||||
|
EPS INFORMATION FOR COMMON SHARES |
||||||||||||||||
|
Income (loss) from continuing operations attributable to iStar(1)(2) |
||||||||||||||||
|
Basic |
$ |
0.65 |
$ |
(0.07) |
$ |
0.85 |
$ |
(0.70) |
||||||||
|
Diluted |
$ |
0.44 |
$ |
(0.07) |
$ |
0.66 |
$ |
(0.70) |
||||||||
|
Net income (loss) |
||||||||||||||||
|
Basic |
$ |
0.65 |
$ |
(0.07) |
$ |
0.85 |
$ |
(0.70) |
||||||||
|
Diluted |
$ |
0.44 |
$ |
(0.07) |
$ |
0.66 |
$ |
(0.70) |
||||||||
|
Adjusted income |
||||||||||||||||
|
Basic |
$ |
0.69 |
$ |
0.32 |
$ |
1.48 |
$ |
0.49 |
||||||||
|
Diluted |
$ |
0.47 |
$ |
0.25 |
$ |
1.06 |
$ |
0.44 |
||||||||
|
Weighted average shares outstanding |
||||||||||||||||
|
Basic |
71,210 |
85,766 |
74,074 |
85,602 |
||||||||||||
|
Diluted (for net income per share) |
115,666 |
85,766 |
118,590 |
85,602 |
||||||||||||
|
Diluted (for adjusted income per share) |
115,666 |
130,368 |
118,590 |
130,200 |
||||||||||||
|
Common shares outstanding at end of period |
71,176 |
85,179 |
71,176 |
85,179 |
||||||||||||
|
_____________________________________________ | ||||||||||||||||
|
(1) Including preferred dividends, net (income) loss attributable to noncontrolling interests and income from sales of | ||||||||||||||||
|
(2) On August 13, 2015, the Company repurchased and retired 100% of the outstanding high performance unit (HPU) | ||||||||||||||||
|
iStar | |||||||
|
Consolidated Balance Sheets | |||||||
|
(In thousands) | |||||||
|
(unaudited) | |||||||
|
As of |
As of | ||||||
|
September 30, 2016 |
December 31, 2015 | ||||||
|
ASSETS |
|||||||
|
Real estate |
|||||||
|
Real estate, at cost |
$ |
1,779,819 |
$ |
2,050,541 |
|||
|
Less: accumulated depreciation |
(405,209) |
(456,558) |
|||||
|
Real estate, net |
$ |
1,374,610 |
$ |
1,593,983 |
|||
|
Real estate available and held for sale |
101,488 |
137,274 |
|||||
|
$ |
1,476,098 |
$ |
1,731,257 |
||||
|
Land and development, net |
1,022,106 |
1,001,963 |
|||||
|
Loans receivable and other lending investments, net |
1,632,186 |
1,601,985 |
|||||
|
Other investments |
262,496 |
254,172 |
|||||
|
Cash and cash equivalents |
547,510 |
711,101 |
|||||
|
Accrued interest and operating lease income receivable, |
12,720 |
18,436 |
|||||
|
Deferred operating lease income receivable |
94,405 |
97,421 |
|||||
|
Deferred expenses and other assets, net |
190,493 |
181,457 |
|||||
|
Total assets |
$ |
5,238,014 |
$ |
5,597,792 |
|||
|
LIABILITIES AND EQUITY |
|||||||
|
Accounts payable, accrued expenses and other liabilities |
$ |
204,272 |
$ |
214,835 |
|||
|
Loan participations payable, net |
205,781 |
152,086 |
|||||
|
Debt obligations, net |
3,749,873 |
4,118,823 |
|||||
|
Total liabilities |
$ |
4,159,926 |
$ |
4,485,744 |
|||
|
Redeemable noncontrolling interests |
$ |
6,601 |
$ |
10,718 |
|||
|
Total iStar shareholders' equity |
$ |
1,025,140 |
$ |
1,059,112 |
|||
|
Noncontrolling interests |
46,347 |
42,218 |
|||||
|
Total equity |
$ |
1,071,487 |
$ |
1,101,330 |
|||
|
Total liabilities and equity |
$ |
5,238,014 |
$ |
5,597,792 |
|||
|
iStar | |||||||||||||||||||||||
|
Segment Analysis | |||||||||||||||||||||||
|
(In thousands) | |||||||||||||||||||||||
|
(unaudited) | |||||||||||||||||||||||
|
FOR THE THREE MONTHS ENDED SEPTEMBER 30, 2016 |
|||||||||||||||||||||||
|
Real |
Net |
Operating |
Land & |
Corporate |
Total | ||||||||||||||||||
|
Operating lease income |
$ |
— |
$ |
36,901 |
$ |
14,407 |
$ |
106 |
$ |
— |
$ |
51,414 |
|||||||||||
|
Interest income |
32,258 |
— |
— |
— |
— |
32,258 |
|||||||||||||||||
|
Other income |
1,052 |
412 |
10,793 |
658 |
527 |
13,442 |
|||||||||||||||||
|
Land development revenue |
— |
— |
— |
31,554 |
— |
31,554 |
|||||||||||||||||
|
Earnings from equity method |
— |
723 |
630 |
21,841 |
3,346 |
26,540 |
|||||||||||||||||
|
Income from sales of real |
— |
6,629 |
27,815 |
— |
— |
34,444 |
|||||||||||||||||
|
Total revenue and other |
$ |
33,310 |
$ |
44,665 |
$ |
53,645 |
$ |
54,159 |
$ |
3,873 |
$ |
189,652 |
|||||||||||
|
Real estate expense |
— |
(4,799) |
(21,129) |
(9,407) |
— |
(35,335) |
|||||||||||||||||
|
Land development cost of |
— |
— |
— |
(22,004) |
— |
(22,004) |
|||||||||||||||||
|
Other expense |
(794) |
— |
— |
— |
(25) |
(819) |
|||||||||||||||||
|
Allocated interest expense |
(14,544) |
(16,330) |
(5,110) |
(9,013) |
(10,108) |
(55,105) |
|||||||||||||||||
|
Allocated general and |
(3,995) |
(4,526) |
(1,502) |
(3,495) |
(4,714) |
(18,232) |
|||||||||||||||||
|
Segment profit (loss) |
$ |
13,977 |
$ |
19,010 |
$ |
25,904 |
$ |
10,240 |
$ |
(10,974) |
$ |
58,157 |
|||||||||||
|
____________________________________________________________ | |||||||||||||||||||||||
|
(1) Excludes $1,434 of stock-based compensation expense. | |||||||||||||||||||||||
|
AS OF SEPTEMBER 30, 2016 |
|||||||||||||||||||||||
|
Real |
Net |
Operating |
Land & |
Corporate |
Total | ||||||||||||||||||
|
Real estate |
|||||||||||||||||||||||
|
Real estate, at cost |
$ |
— |
$ |
1,364,069 |
$ |
415,750 |
$ |
— |
$ |
— |
$ |
1,779,819 |
|||||||||||
|
Less: accumulated |
— |
(362,293) |
(42,916) |
— |
— |
(405,209) |
|||||||||||||||||
|
Real estate, net |
$ |
— |
$ |
1,001,776 |
$ |
372,834 |
$ |
— |
$ |
— |
$ |
1,374,610 |
|||||||||||
|
Real estate available |
— |
— |
101,488 |
— |
— |
101,488 |
|||||||||||||||||
|
Total real estate |
$ |
— |
$ |
1,001,776 |
$ |
474,322 |
$ |
— |
$ |
— |
$ |
1,476,098 |
|||||||||||
|
Land and development, |
— |
— |
— |
1,022,106 |
— |
1,022,106 |
|||||||||||||||||
|
Loans receivable and other |
1,632,186 |
— |
— |
— |
— |
1,632,186 |
|||||||||||||||||
|
Other investments |
— |
103,468 |
12,747 |
92,885 |
53,396 |
262,496 |
|||||||||||||||||
|
Total portfolio assets |
$ |
1,632,186 |
$ |
1,105,244 |
$ |
487,069 |
$ |
1,114,991 |
$ |
53,396 |
$ |
4,392,886 |
|||||||||||
|
Cash and other assets |
845,128 |
||||||||||||||||||||||
|
Total assets |
$ |
5,238,014 |
|||||||||||||||||||||
|
iStar | ||||||||||||||||
|
Supplemental Information | ||||||||||||||||
|
(In thousands) | ||||||||||||||||
|
(unaudited) | ||||||||||||||||
|
Three Months |
Nine Months | |||||||||||||||
|
2016 |
2015 |
2016 |
2015 | |||||||||||||
|
ADJUSTED INCOME (1) |
||||||||||||||||
|
Reconciliation of Net Income to Adjusted Income |
||||||||||||||||
|
Net income (loss) allocable to common shareholders |
$ |
46,292 |
$ |
(6,072) |
$ |
63,210 |
$ |
(59,818) |
||||||||
|
Add: Depreciation and amortization |
15,598 |
17,560 |
50,107 |
54,925 |
||||||||||||
|
Add: (Recovery of) provision for loan losses |
(14,955) |
7,500 |
(12,749) |
30,944 |
||||||||||||
|
Add: Impairment of assets |
8,741 |
6,398 |
12,668 |
12,409 |
||||||||||||
|
Add: Stock-based compensation expense |
1,434 |
2,881 |
7,644 |
10,066 |
||||||||||||
|
Add: Loss on early extinguishment of debt |
36 |
67 |
1,618 |
279 |
||||||||||||
|
Less: Losses on charge-offs and dispositions |
(8,039) |
(517) |
(12,602) |
(3,713) |
||||||||||||
|
Less: HPU/Participating Security allocation |
— |
(516) |
(21) |
(2,778) |
||||||||||||
|
Adjusted income allocable to common shareholders |
$ |
49,107 |
$ |
27,301 |
$ |
109,875 |
$ |
42,314 |
||||||||
|
_________________________________________________________ | ||||||||||||||||
|
(1) Adjusted Income allocable to common shareholders should be examined in conjunction with net income (loss) as shown in | ||||||||||||||||
|
iStar | |||||||||||
|
Supplemental Information | |||||||||||
|
(In thousands) | |||||||||||
|
(unaudited) | |||||||||||
|
Twelve Months Ended | |||||||||||
|
OPERATING STATISTICS |
|||||||||||
|
Expense Ratio |
|||||||||||
|
General and administrative expenses - trailing twelve months (A) |
$ |
81,190 |
|||||||||
|
Average total assets (B) |
$ |
5,436,035 |
|||||||||
|
Expense Ratio (A) / (B) |
1.5% |
||||||||||
|
As of | |||||||||||
|
September 30, 2016 | |||||||||||
|
UNENCUMBERED ASSETS / UNSECURED DEBT |
|||||||||||
|
Unencumbered assets (C)(1) |
$ |
4,133,574 |
|||||||||
|
Unsecured debt (D) |
$ |
3,047,972 |
|||||||||
|
Unencumbered Assets / Unsecured Debt (C) / (D) |
1.4x |
||||||||||
|
UNFUNDED COMMITMENTS |
|||||||||||
|
Performance-based commitments(2) |
$ |
495,042 |
|||||||||
|
Strategic investments |
45,823 |
||||||||||
|
Discretionary fundings |
— |
||||||||||
|
Total Unfunded Commitments |
$ |
540,865 |
|||||||||
|
LOAN RECEIVABLE CREDIT STATISTICS |
As of | ||||||||||
|
September 30, 2016 |
December 31, 2015 | ||||||||||
|
Carrying value of NPLs / |
|||||||||||
|
As a percentage of total carrying value of loans |
$ |
222,484 |
14.2% |
$ |
60,327 |
3.9% |
|||||
|
Total reserve for loan losses / |
|||||||||||
|
As a percentage of total gross carrying value of loans(3) |
$ |
95,416 |
5.7% |
$ |
108,165 |
6.6% |
|||||
|
___________________________________________ | |||||||||||
|
(1) Unencumbered assets are calculated in accordance with the indentures governing the Company's unsecured | |||||||||||
|
(2) Excludes $212.1 million of commitments on loan participations sold that are not the obligation of the Company | |||||||||||
|
(3) Gross carrying value represents iStar's carrying value of loans, gross of loan loss reserves. | |||||||||||
|
iStar | ||||||||||||||||||||||
|
Supplemental Information | ||||||||||||||||||||||
|
(In millions) | ||||||||||||||||||||||
|
(unaudited) | ||||||||||||||||||||||
|
PORTFOLIO STATISTICS AS OF SEPTEMBER 30, 2016(1) | ||||||||||||||||||||||
|
Property Type |
Real |
Net |
Operating |
Land & |
Total |
% of | ||||||||||||||||
|
Land & Development |
$ |
48 |
$ |
— |
$ |
— |
$ |
1,122 |
$ |
1,170 |
24% | |||||||||||
|
Office / Industrial |
164 |
767 |
25 |
— |
956 |
20% | ||||||||||||||||
|
Mixed Use / Collateral |
503 |
— |
176 |
— |
679 |
14% | ||||||||||||||||
|
Hotel |
343 |
136 |
104 |
— |
583 |
12% | ||||||||||||||||
|
Entertainment / Leisure |
— |
494 |
— |
— |
494 |
10% | ||||||||||||||||
|
Condominium |
326 |
— |
101 |
— |
427 |
9% | ||||||||||||||||
|
Retail |
64 |
57 |
124 |
— |
245 |
5% | ||||||||||||||||
|
Other Property Types |
205 |
14 |
— |
— |
219 |
5% | ||||||||||||||||
|
Strategic Investments |
— |
— |
— |
— |
53 |
1% | ||||||||||||||||
|
Total |
$ |
1,653 |
$ |
1,468 |
$ |
530 |
$ |
1,122 |
$ |
4,826 |
100% | |||||||||||
|
Geography |
Real |
Net |
Operating |
Land & |
Total |
% of | ||||||||||||||||
|
Northeast |
$ |
970 |
$ |
382 |
$ |
45 |
$ |
233 |
$ |
1,630 |
34% | |||||||||||
|
West |
103 |
317 |
39 |
367 |
826 |
17% | ||||||||||||||||
|
Southeast |
129 |
236 |
162 |
154 |
681 |
14% | ||||||||||||||||
|
Mid-Atlantic |
168 |
151 |
68 |
217 |
604 |
13% | ||||||||||||||||
|
Southwest |
51 |
160 |
139 |
146 |
496 |
10% | ||||||||||||||||
|
Central |
164 |
80 |
62 |
— |
306 |
6% | ||||||||||||||||
|
Various |
68 |
142 |
15 |
5 |
230 |
5% | ||||||||||||||||
|
Strategic Investments |
— |
— |
— |
— |
53 |
1% | ||||||||||||||||
|
Total |
$ |
1,653 |
$ |
1,468 |
$ |
530 |
$ |
1,122 |
$ |
4,826 |
100% | |||||||||||
|
______________________________________________________________________________ | ||||||||||||||||||||||
|
(1) Based on carrying value of the Company's total investment portfolio, gross of accumulated depreciation and general loan | ||||||||||||||||||||||
Photo - http://photos.prnewswire.com/prnh/20161102/435641
Logo - http://photos.prnewswire.com/prnh/20130708/NY43293LOGO
To view the original version on PR Newswire, visit:http://www.prnewswire.com/news-releases/istar-announces-third-quarter-2016-results-300356688.html
SOURCE iStar

Please make the indicated changes including the new text: US quotes snapshot data provided by IEX. Additional price data and company information powered by Twelve Data.