
S&P 500 Q2 2023 Buybacks Decline 18.8%, As Sector Expenditures Shift Again; Buyback Tax Reduced Operating Earnings by 0.34%
S&P 500 Q2 2023 Buybacks Decline 18.8%, As Sector Expenditures Shift Again; Buyback Tax Reduced Operating Earnings by 0.34%
PR Newswire
NEW YORK, Sept. 12, 2023
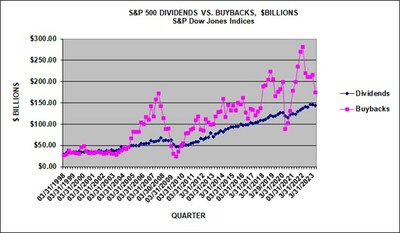
- S&P 500 Q2 2023 buybacks were $174.9 billion, down 18.8% from Q1 2023's $215.5 billion and down 20.4% from the Q2 2022 $219.6 billion
- The 12-month June 2023 expenditure of $812.5 billion was down 19.2% from the record $1.005 trillion expenditure of June 2022
- Financials pulled back to $32.7 billion after increasing to $46.9 billion in Q1 2023 from their 36.3% pullback in 2022 over concerns in banking and regulation; Information Technology regained the lead spending $47.1 billion in Q2 2023
- Energy spent $18.3 billion, representing 10.4% of all buybacks, whereas the sector represented 4.1% of the market value, with Exxon and Chevron both placing on the top five list for the quarter
- The new net buyback 1% excise tax, which started in 2023, reduced Q2 2023 operating earnings by 0.34% (0.45% in Q1 2023) and As Reported GAAP by 0.38% (0.49%)
NEW YORK, Sept. 12, 2023 /PRNewswire/ -- S&P Dow Jones Indices ("S&P DJI") announced today preliminary S&P 500® stock buybacks, or share repurchases, data for Q2 2023.
Historical data on S&P 500 buybacks are available at www.spdji.com/indices/equity/sp-500.
Key Takeaways:
- Q2 2023 share repurchases were $174.9 billion, down 18.8% from Q1 2023's $215.5 billion expenditure and down 20.4% from Q2 2022's $219.6 billion.
- 304 companies reported buybacks of at least $5 million for the quarter, down from 358 in Q1 2023 and down from 331 in Q2 2022; 367 companies did some buybacks for the quarter, down from 390 in Q1 2023 and down from 384 in Q2 2022; 434 companies did some buybacks for the 12-months ending June 2023, down from 437 in the prior 2022 period.
- Buybacks remained top heavy with the top 20 companies accounting for 52.0% of Q2 2023 buybacks, above the 48.6% of Q1 2023, above the historical average of 47.2%, and above the pre-COVID historical average of 44.5%.
- For the 12-months ending June 2023, buybacks were $812.5 billion, down from the record $1.005 trillion for the prior 12-month June 2022 period.
- 16.3% of companies reduced share counts used for earnings-per-share (EPS) by at least 4% year-over-year, down from Q1 2023's 18.5% and down from Q2 2022's 19.8%; for Q2 2023 165 issues increased their shares used for EPS over Q1 2023, and 275 reduced them.
- S&P 500 Q2 2023 dividends decreased 2.4% to $143.2 billion from the prior Q1 2023's record of $146.8 billion and were 1.9% greater than the $140.6 billion in Q2 2022. For the 12-months ending in June 2023, dividends set a record $576.4 billion payment, up 6.2% on an aggregate basis from the 12-month June 2022's $542.1 billion.
- Total shareholders return of buybacks and dividends decreased to $318.1 billion in Q2 2023, down12.2% from Q1 2023's $362.3 billion and down 11.7% from Q2 2022's $360.2 billion. Total shareholder returns for the 12-months ending June 2023 decreased to $1.389 trillion from the 12-month June 2022 record $1.547 trillion.
- The new 1% excise tax on net buybacks, which started in 2023, reduced the Q2 2023 S&P 500 operating earnings by 0.34% and As Reported GAAP earnings by 0.38%; the proforma for full year 2022 was a 0.51% reduction for operating and a 0.58% reduction for as reported.
"Companies broadly reduced their buybacks in Q2 2023, as concerns over banking and a slowing economy dominated. Companies with strong cash-flow led the buybacks, as the top 20 issues accounted for 52%. Financials pulled back 30.2% after restarting their buybacks in Q1 2023 and following their 2022 pullback. Energy, which represented 4.1% of the equity market, represented 10.4% of the buybacks; Exxon and Chevron ranked in the top five for the quarter. The EPS impact, due to share count reduction, also declined with the value of buybacks now being re-evaluated with respect to its cost-support tradeoff. Still, 16.3% of the issues increased their Q2 2023 EPS year-over-year by at least 4% compared to 18.5% last quarter," said Howard Silverblatt, Senior Index Analyst at S&P Dow Jones Indices. "Going forward and given the market's expectations that higher interest rates will continue for longer and new banking regulations will be implemented, buyback expenditure in excess of option coverage will be challenged for all but the top-tier cash-flow issues. Notably, and potentially adding to the cost further is the ongoing budget discussions and quest for government income as the new 1% buyback tax appears to be an attractive target from both sides of the aisle to increase."
1% Buyback Excise Tax for 2023:
The new 1% excise tax on net buybacks reduced Q2 2023 operating earnings by 0.34%, down from the Q1 2023 0.45%, and down from the proforma 0.52% for Q2 2022 and the proforma 2022 0.51%. As reported GAAP earnings were reduced by 0.38%, down from the Q1 2023 0.49%, down from the proforma 0.57% for Q2 2022, and the proforma 2022 0.58%.
Silverblatt added: "The 1% tax is an additional cost, but it is still not significant enough to impact the overall buybacks at this point. Given the initial 1% buyback tax had bipartisan support, there is an expectation that some increase and/or potential change to the type of buybacks that are taxed are on the table and will remain past the current budget discussions. An increase to the 2.5% area could start to impact buybacks and the EPS impact of share-count-reduction due to some of the expenditures shifting from buybacks to dividends. Any shift however would not be on a-dollar-for-dollar basis, as dividends remain a long-term pure cash-flow item which must be incorporated into corporate budgets, and therefore move much slower."
Q2 2023 GICS® Sector Analysis:
Information Technology regained the lead from Financials which took over the lead in Q1 2023 that Information Technology had held since Q3 2017. For Q2 2023 the sector increased their expenditure 2.6% to $47.1 billion, representing 26.9% of all S&P 500 buybacks. This is compared to the $45.9 billion spent in Q1 2023, representing 21.3% of all buybacks; for Q2 2022 the sector spent $72.0 billion, 65.5% higher. For the 12-month June period the sector spent $211.5 billion, down 25.7% from the prior period's $284.5 billion.
Financials pulled back for the quarter as concerns over banking and expected new regulations increased. The sector pulled back in Q2, Q3 and Q4 2022 over economic issues and to protect their dividends, but then started up again in Q1 2023. For Q2 2023, Financials spent $32.7 billion on buybacks, accounting for 18.7% of all S&P 500 buybacks, down from the Q1 2023 expenditure of $46.9 billion. This represented 21.8% of the buybacks, as they remained higher than the lowered $21.2 billion expenditure of Q2 2022, when they represented 9.7% of the buybacks. For the 12-month June 2023 period, Financials spent $125.2 billion, down from $189.3 billion for the 12-month June 2022 period. Given the current banking environment and planned new regulatory requirements, Financials may limit their current buybacks as they again look to protect their dividends.
Energy decreased their buybacks for the second quarter by 5.4% to $18.3 billion, representing 10.4% of the buybacks compared to the prior quarter's $19.3 billion, as the Q2 2023 quarter was an increase of 36.4% over Q2 2022's $13.4 billion level. For the 12-month period ending in June 2023, Energy spent $79.4 billion on buybacks, up 144% from the prior period's $32.5 billion.
Health Care buybacks decreased 42.2% for the quarter spending $13.4 billion in Q2 2023, representing 7.7% of all buybacks. This was down from the Q1 2023 $23.2 billion and Q2 2022's $17.2 billion. For the 12-month June period, the sector spent $81.1 billion, down 15.8% from prior 12-month period's $96.3 billion.
Of note, Real Estate significantly pulled back on their Q2 2023 buybacks to $71 million, down -86.5% from the Q1 2023 $526 million and down 93.7% from the Q2 2022 $1.127 billion.
Issues:
The five issues with the highest total buybacks for Q2 2023 are:
- Apple (AAPL): Once again spent the most of any issue with its Q2 2023 expenditure ranking as the sixteenth highest in S&P 500 history. For the quarter, the company spent $19.9 billion, down from Q1 2023's $20.0 billion (the fifteenth largest in index history). Apple holds 18 of the top 20 record quarters (Meta Platforms holds #12 and QUALCOMM holds #13). For the 12 months ending in June 2023, Apple spent $86.4 billion on buybacks, down from the prior 12-month period's $91.3 billion. Over the five-year period, Apple has spent $414.9 billion, and $624.8 billion over the ten-year period.
- Alphabet (GOOG/L): $15.0 billion for Q2 2023, up from the $14.6 billion in Q1 2023; the 12-month expenditure was $60.3 billion versus the prior period's expenditure of $54.6 billion.
- Microsoft (MSFT): $5.7 billion for Q2 2023, up from $5.5 billion in Q1 2023; the 12-month expenditure was $22.2 billion versus the prior period's $32.7 billion.
- Exxon Mobil (XOM): $4.3 billion for Q2 2023, the same as Q1 2023; the 12-month expenditure was $17.8 billion versus the prior period's $6.1 billion.
- Chevon (CVX): $4.3 billion in Q2 2023, up from $3.6 billion in Q1 2023; the 12-month expenditure was $15.1 billion versus the prior periods $2.3 billion.
For more information about S&P Dow Jones Indices, please visit www.spdji.com.
S&P Dow Jones Indices | |||
S&P 500 proforma net buyback tax impact | |||
TAX | TAX % OF | TAX % OF | |
$ BILLIONS | OPERATING | AS REPORTED | |
Q2 2023 | $1.55 | 0.34 % | 0.38 % |
Q1 2023 | $1.98 | 0.45 % | 0.49 % |
2022 proforma | $8.47 | 0.51 % | 0.58 % |
2021 proforma | $7.93 | 0.45 % | 0.47 % |
S&P Dow Jones Indices | ||||||||
S&P 500, $ U.S. BILLIONS | (preliminary in bold) | |||||||
PERIOD | MARKET | OPERATING | AS REPORTED | DIVIDEND & | ||||
VALUE | EARNINGS | EARNINGS | DIVIDENDS | BUYBACKS | DIVIDEND | BUYBACK | BUYBACK | |
$ BILLIONS | $ BILLIONS | $ BILLIONS | $ BILLIONS | $ BILLIONS | YIELD | YIELD | YIELD | |
12 Mo Jun,'23 | $37,162 | $1,741.00 | $1,515.44 | $576.37 | $812.49 | 1.55 % | 2.19 % | 3.74 % |
12 Mo Jun,'22 | $31,903 | $1,733.78 | $1,626.26 | $542.09 | $1,005.39 | 1.70 % | 3.15 % | 4.85 % |
2022 | $32,133 | $1,656.66 | $1,453.43 | $564.57 | $922.68 | 1.76 % | 2.87 % | 4.63 % |
2021 | $40,356 | $1,762.75 | $1,675.22 | $511.23 | $881.72 | 1.27 % | 2.18 % | 3.45 % |
2020 | $31,659 | $1,019.04 | $784.21 | $483.18 | $519.76 | 1.53 % | 1.64 % | 3.17 % |
2019 | $26,760 | $1,304.76 | $1,158.22 | $485.48 | $728.74 | 1.81 % | 2.72 % | 4.54 % |
2018 | $21,027 | $1,281.66 | $1,119.43 | $456.31 | $806.41 | 2.17 % | 3.84 % | 6.01 % |
6/30/2023 Prelim. | $37,162 | $457.43 | $406.33 | $143.20 | $174.92 | 1.55 % | 2.19 % | 3.74 % |
3/31/2023 | $34,342 | $439.08 | $404.57 | $146.76 | $215.53 | 1.67 % | 2.50 % | 4.17 % |
12/31/2022 | $32,133 | $421.55 | $331.50 | $146.07 | $211.19 | 1.76 % | 2.87 % | 4.63 % |
9/30/2022 | $30,119 | $422.94 | $373.04 | $140.34 | $210.84 | 1.83 % | 3.26 % | 5.09 % |
6/30/2022 | $31,903 | $395.02 | $360.21 | $140.56 | $219.64 | 1.70 % | 3.15 % | 4.85 % |
3/31/2022 | $38,288 | $417.16 | $388.68 | $137.60 | $281.01 | 1.37 % | 2.57 % | 3.94 % |
12/31/2021 | $40,356 | $480.35 | $456.72 | $133.90 | $270.10 | 1.27 % | 2.18 % | 3.45 % |
9/30/2021 | $36,538 | $441.26 | $420.64 | $130.04 | $234.64 | 1.37 % | 2.03 % | 3.40 % |
6/30/2021 | $36,325 | $439.95 | $409.02 | $123.38 | $198.84 | 1.33 % | 1.68 % | 3.01 % |
3/31/2021 | $33,619 | $401.19 | $388.84 | $123.91 | $178.13 | 1.43 % | 1.48 % | 2.91 % |
12/31/2020 | $31,659 | $321.81 | $265.00 | $121.62 | $130.59 | 1.53 % | 1.64 % | 3.17 % |
9/30/2020 | $27,868 | $314.06 | $273.29 | $115.54 | $101.79 | 1.75 % | 2.05 % | 3.80 % |
6/30/2020 | $25,637 | $221.53 | $147.44 | $119.04 | $88.66 | 1.93 % | 2.52 % | 4.45 % |
3/31/2020 | $21,424 | $161.64 | $98.48 | $126.98 | $198.72 | 2.31 % | 3.37 % | 5.68 % |
12/31/2019 | $26,760 | $324.52 | $294.29 | $126.35 | $181.58 | 1.81 % | 2.72 % | 4.54 % |
9/30/2019 | $24,707 | $330.42 | $282.12 | $123.12 | $175.89 | 1.94 % | 3.12 % | 5.06 % |
6/28/2019 | $24,423 | $333.26 | $290.00 | $118.68 | $165.46 | 1.93 % | 3.27 % | 5.20 % |
S&P Dow Jones Indices | |||||||
S&P 500 SECTOR BUYBACKS | |||||||
SECTOR $ MILLIONS | Q2,'23 | Q1,'23 | Q2,'22 | 12MoJun,'23 | 12MoJun,'22 | 5-YEARS | 10-YEARS |
Consumer Discretionary | $17,664 | $18,301 | $27,639 | $74,326 | $107,319 | $360,087 | $789,347 |
Consumer Staples | $4,265 | $6,284 | $10,662 | $28,897 | $40,234 | $160,867 | $378,555 |
Energy | $18,253 | $19,304 | $13,383 | $79,404 | $32,523 | $153,128 | $266,420 |
Financials | $32,742 | $46,891 | $21,216 | $125,157 | $189,347 | $737,324 | $1,231,704 |
Healthcare | $13,408 | $23,194 | $17,201 | $81,148 | $96,345 | $399,404 | $775,551 |
Industrials | $12,585 | $14,239 | $17,834 | $66,340 | $76,414 | $303,400 | $650,413 |
Information Technology | $47,134 | $45,923 | $71,956 | $211,481 | $284,462 | $1,185,350 | $1,930,264 |
Materials | $3,154 | $3,773 | $8,726 | $19,152 | $30,657 | $91,190 | $160,471 |
Real Estate | $71 | $526 | $1,127 | $2,119 | $3,175 | $12,654 | $19,025 |
Communication Services | $25,371 | $35,797 | $29,441 | $122,620 | $142,045 | $453,001 | $467,623 |
Utilities | $279 | $1,299 | $453 | $1,844 | $2,869 | $13,685 | $19,172 |
TOTAL | $174,924 | $215,532 | $219,637 | $812,488 | $1,005,390 | $3,870,091 | $6,688,545 |
SECTOR BUYBACK MAKEUP % | Q2,'23 | Q1,'23 | Q2,'22 | 12MoJun,'23 | 12MoJun,'22 | 5-YEARS | 10-YEARS |
Consumer Discretionary | 10.10 % | 8.49 % | 12.58 % | 9.15 % | 10.67 % | 9.30 % | 11.80 % |
Consumer Staples | 2.44 % | 2.92 % | 4.85 % | 3.56 % | 4.00 % | 4.16 % | 5.66 % |
Energy | 10.43 % | 8.96 % | 6.09 % | 9.77 % | 3.23 % | 3.96 % | 3.98 % |
Financials | 18.72 % | 21.76 % | 9.66 % | 15.40 % | 18.83 % | 19.05 % | 18.42 % |
Healthcare | 7.66 % | 10.76 % | 7.83 % | 9.99 % | 9.58 % | 10.32 % | 11.60 % |
Industrials | 7.19 % | 6.61 % | 8.12 % | 8.17 % | 7.60 % | 7.84 % | 9.72 % |
Information Technology | 26.95 % | 21.31 % | 32.76 % | 26.03 % | 28.29 % | 30.63 % | 28.86 % |
Materials | 1.80 % | 1.75 % | 3.97 % | 2.36 % | 3.05 % | 2.36 % | 2.40 % |
Real Estate | 0.04 % | 0.24 % | 0.51 % | 0.26 % | 0.32 % | 0.33 % | 0.28 % |
Communication Services | 14.50 % | 16.61 % | 13.40 % | 15.09 % | 14.13 % | 11.71 % | 6.99 % |
Utilities | 0.16 % | 0.60 % | 0.21 % | 0.23 % | 0.29 % | 0.35 % | 0.29 % |
TOTAL | 100.00 % | 100.00 % | 100.00 % | 100.00 % | 100.00 % | 100.00 % | 100.00 % |
S&P Dow Jones Indices | ||||||||||
S&P 500 20 LARGEST Q2 2023 BUYBACKS, $ MILLIONS | ||||||||||
Company | Ticker | Sector | Q2 2023 | Q1 2023 | Q2 2022 | 12-Months | 12-Months | 5-Year | 10-Year | Indicated |
Buybacks | Buybacks | Buybacks | Jun,'23 | Jun,'22 | Buybacks | Buybacks | Dividend | |||
$ Million | $ Million | $ Million | $ Million | $ Million | $ Million | $ Million | $ Million | |||
Apple | AAPL | Information Technology | $19,863 | $20,012 | $24,562 | $86,402 | $91,338 | $414,888 | $624,756 | $14,194 |
Alphabe | GOOGL | Communication Services | $14,969 | $14,557 | $15,197 | $60,325 | $54,580 | $193,491 | $208,035 | $0 |
Microsoft | MSFT | Information Technology | $5,704 | $5,509 | $8,757 | $22,245 | $32,696 | $124,837 | $185,074 | $20,225 |
Exxon Mobil | XOM | Energy | $4,340 | $4,340 | $3,919 | $17,849 | $6,140 | $25,186 | $50,908 | $14,717 |
Chevron | CVX | Energy | $4,340 | $3,607 | $1,689 | $15,061 | $2,307 | $23,488 | $30,366 | $10,751 |
Wells Fargo | WFC | Financials | $4,005 | $4,016 | $4 | $8,032 | $18,325 | $72,305 | $119,108 | $5,253 |
NVIDIA | NVDA | Information Technology | $3,739 | $507 | $3,650 | $9,582 | $7,239 | $20,598 | $25,642 | $396 |
T-Mobile US | TMUS | Communication Services | $3,661 | $4,806 | $43 | $11,495 | $237 | $32,219 | $34,317 | $0 |
Booking Holdings | BKNG | Consumer Discretionary | $3,099 | $2,150 | $1,239 | $9,582 | $2,301 | $25,589 | $34,633 | $0 |
Marathon Petroleum | MPC | Energy | $3,068 | $3,180 | $0 | $10,156 | $6,516 | $19,681 | $29,038 | $1,273 |
Visa | V | Financials | $3,048 | $2,200 | $2,434 | $10,581 | $12,572 | $47,588 | $76,031 | $2,913 |
UnitedHealth Group | UNH | Health Care | $3,000 | $2,000 | $2,500 | $7,000 | $7,100 | $28,100 | $41,074 | $7,001 |
Meta Platforms | META | Communication Services | $2,590 | $10,374 | $6,235 | $27,849 | $53,268 | $120,148 | $132,661 | $0 |
JPMorgan Chase | JPM | Financials | $2,477 | $2,690 | $707 | $5,167 | $10,570 | $67,599 | $113,145 | $12,274 |
Mastercard | MA | Financials | $2,419 | $2,954 | $2,384 | $9,343 | $7,769 | $33,644 | $51,969 | $1,908 |
Lowe's Companies | LOW | Consumer Discretionary | $2,250 | $2,106 | $4,091 | $10,352 | $14,966 | $41,967 | $60,113 | $2,624 |
Broadcom | AVGO | Information Technology | $2,167 | $3,420 | $1,792 | $7,382 | $8,447 | $25,588 | $31,393 | $7,671 |
Deere | DE | Industrials | $2,147 | $1,289 | $1,301 | $5,813 | $3,285 | $13,385 | $20,332 | $1,348 |
Home Depot | HD | Consumer Discretionary | $2,067 | $2,887 | $1,654 | $7,688 | $11,866 | $41,057 | $77,258 | $8,466 |
Comcast | CMCSA | Communication Services | $2,051 | $2,176 | $3,065 | $11,267 | $10,003 | $25,587 | $51,373 | $4,825 |
Top 20 | $91,004 | $94,780 | $85,223 | $353,171 | $361,525 | $1,396,945 | $1,997,226 | $115,837 | ||
S&P 500 | $174,924 | $215,532 | $219,637 | $812,488 | $1,005,390 | $3,870,091 | $6,688,545 | $578,941 | ||
Top 20 % of S&P 500 | 52.02 % | 43.97 % | 38.80 % | 43.47 % | 35.96 % | 36.10 % | 29.86 % | 20.01 % | ||
Gross values are not adjusted for float | ||||||||||
S&P Dow Jones Indices | ||||
S&P 500 Q2 2023 Buyback Report | ||||
SECTOR | DIVIDEND | BUYBACK | COMBINED | |
YIELD | YIELD | YIELD | ||
Consumer Discretionary | 0.83 % | 1.82 % | 2.65 % | |
Consumer Staples | 2.69 % | 1.26 % | 3.95 % | |
Energy | 3.26 % | 4.63 % | 7.89 % | |
Financials | 1.93 % | 3.01 % | 4.95 % | |
HealthCare | 1.69 % | 1.62 % | 3.31 % | |
Industrials | 1.69 % | 2.11 % | 3.79 % | |
Information Technology | 0.82 % | 1.85 % | 2.67 % | |
Materials | 2.02 % | 2.11 % | 4.13 % | |
Real Estate | 3.54 % | 0.23 % | 3.77 % | |
Communications Services | 1.00 % | 4.70 % | 5.70 % | |
Utilities | 3.48 % | 0.20 % | 3.67 % | |
S&P 500 | 1.57 % | 2.20 % | 3.77 % | |
Uses full values (unadjusted for float) | ||||
Dividends based on indicated; buybacks based on the last 12-months ending Q2,'23 | ||||
Share Count Changes | ||
(Y/Y diluted shares used for EPS) | >=4% | <=-4% |
Q2 2023 | 4.22 % | 16.27 % |
Q1 2023 | 4.02 % | 18.47 % |
Q4 2022 | 5.01 % | 19.44 % |
Q3 2022 | 7.21 % | 21.24 % |
Q2 2022 | 8.42 % | 19.84 % |
Q1 2022 | 7.62 % | 17.64 % |
Q4 2021 | 10.06 % | 14.89 % |
Q3 2021 | 10.22 % | 7.41 % |
Q2 2021 | 11.02 % | 5.41 % |
Q1 2021 | 10.40 % | 5.80 % |
Q4 2020 | 9.02 % | 6.01 % |
Q3 2020 | 8.62 % | 9.62 % |
Q2 2020 | 8.60 % | 17.80 % |
ABOUT S&P DOW JONES INDICES
S&P Dow Jones Indices is the largest global resource for essential index-based concepts, data and research, and home to iconic financial market indicators, such as the S&P 500® and the Dow Jones Industrial Average®. More assets are invested in products based on our indices than products based on indices from any other provider in the world. Since Charles Dow invented the first index in 1884, S&P Dow Jones Indices has been innovating and developing indices across the spectrum of asset classes helping to define the way investors measure and trade the markets.
S&P Dow Jones Indices is a division of S&P Global (NYSE: SPGI), which provides essential intelligence for individuals, companies, and governments to make decisions with confidence. For more information, visit: https://www.spglobal.com/spdji/en/.
S&P Dow Jones Indices Media Contacts:
April Kabahar
(+1) 917 796 3121
[email protected]
Alyssa Augustyn
(+1) 773 919 4732
[email protected]
S&P Dow Jones Indices Index Services:
Howard Silverblatt
Senior Index Analyst
(+1) 973 769 2306
[email protected]

![]()
![]() View original content to download multimedia:https://www.prnewswire.com/news-releases/sp-500-q2-2023-buybacks-decline-18-8-as-sector-expenditures-shift-again-buyback-tax-reduced-operating-earnings-by-0-34-301924762.html
View original content to download multimedia:https://www.prnewswire.com/news-releases/sp-500-q2-2023-buybacks-decline-18-8-as-sector-expenditures-shift-again-buyback-tax-reduced-operating-earnings-by-0-34-301924762.html
SOURCE S&P Dow Jones Indices

Please make the indicated changes including the new text: US quotes snapshot data provided by IEX. Additional price data and company information powered by Twelve Data.